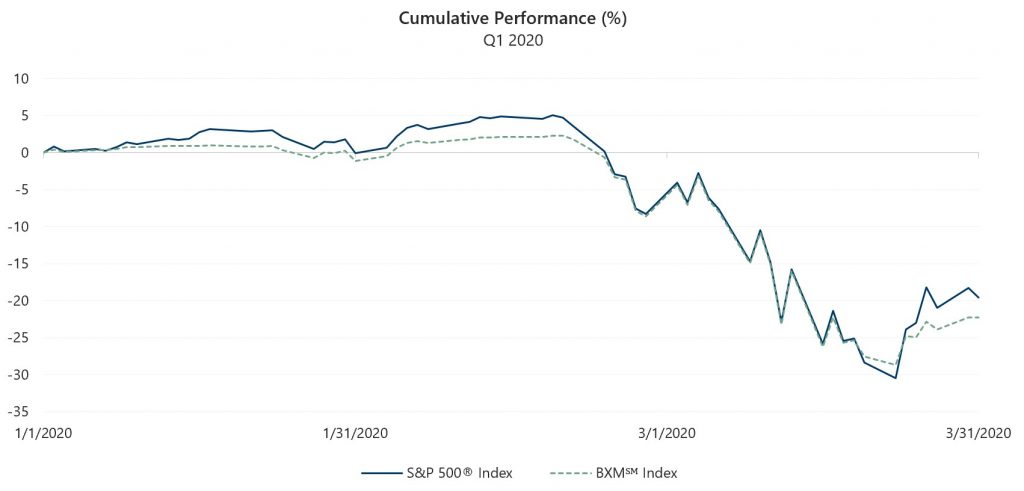
The S&P 500® Index declined 19.60% in the first quarter of 2020, the worst start to any year in stock market history. The equity market decline accelerated throughout the quarter with monthly declines of 0.04%, 8.23% and 12.35% in January, February and March, respectively. From its all-time high on February 19 through March 23, the S&P 500® Index rapidly entered bear market territory with a decline of 33.79% before staging a partial recovery. Between March 23 and quarter-end, the S&P 500® Index climbed 15.57%.
The 2020’s got off to a roaring start, but not in a good way. Investors witnessed the signing of major global trade deals and positive backward-looking economic data, but a global pandemic triggered extreme volatility and ended one of the longest bull markets in history. The emergence of the COVID-19 illness led governments around the world to take unprecedented steps to slow the contagion, effectively shuttering major portions of their economies. Economic data releases toward the end of the first quarter of 2020 began to show the severe impact of these measures. As of March 6, the U.S. unemployment rate was 3.5%, a 50-year low, with nonfarm payroll growth regularly exceeding the top-end of expectations. On March 26, following the previous week in which stringent social distancing guidelines were issued for many parts of the country, initial jobless claims reflected more than 3.2 million new claims. Prior to this upheaval, a tight employment situation and strong consumer confidence led to a year-over-year change for the February Consumer Price Index of 2.3%, at the top of expectations and above the Federal Reserve’s (the Fed) 2% target. Also, on March 26, the third estimate of Q4 GDP growth came in at 2.1%, at the top of consensus estimates. Corporate earnings also showed growth and, with more than 86% of companies reporting, over 77% met or beat expectations with fourth quarter 2019 earnings growth nearly 2% quarter-over-quarter and nearly 3% year-over-year.
Policy responses to the pandemic and its impact on capital markets and the economy were significant. The Fed took multiple accommodative steps in a proactive attempt to stem the economic drag of the COVID-19 mitigation measures. On March 3, the Fed cut its benchmark rate by 25 basis points (bps) before cutting it again by 50 bps – on a Sunday. This marks the first time the Fed has moved to cut interest rates on two separate occasions between scheduled meetings. In addition to these actions, the Fed resurrected several crisis-era efforts to address liquidity concerns, including the purchase of Treasury and mortgage-backed securities. As the equity market declined, calls for Congress to enact fiscal stimulus intensified. The market began its partial recovery during the same week that a $2.2 trillion stimulus package was proposed, debated and passed by both houses of Congress.
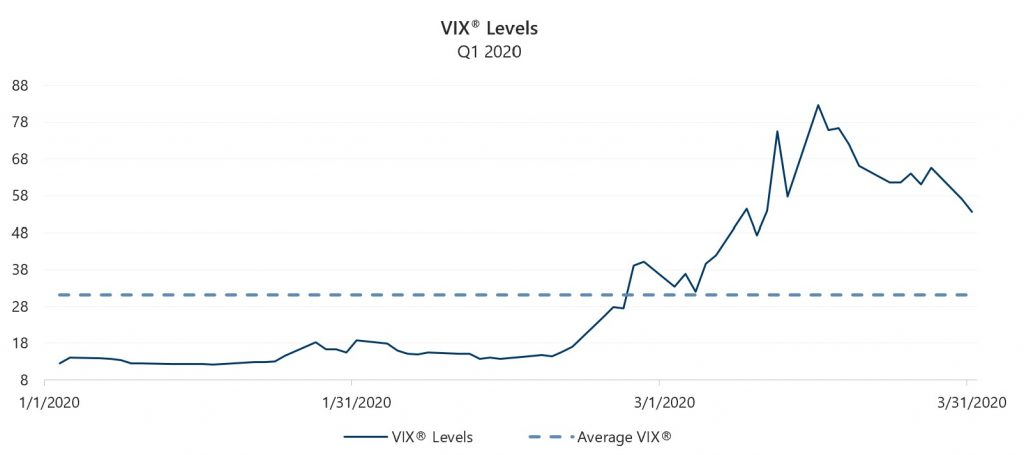
The Cboe® Volatility Index® (the VIX®) averaged 31.22 in the first quarter of 2020, well above its historical average of 19.24. The first quarter closing high for the VIX® was 82.69 on March 16, its highest close in history. The intra-day high for the first quarter was 85.47 on March 18, only slightly off its highest-ever intra-day value of 89.53 recorded on October 24, 2008. The VIX® drifted lower to close the quarter at 53.54 as the S&P 500® Index staged a partial recovery during the end of March. The first quarter closing low for the VIX® was 12.10 on January 17. In a reversal of its typical relationship, realized volatility reached 56.95% for the quarter – as measured by the annualized standard deviation of daily returns for the S&P 500® Index – and exceeded average implied volatility for the period. The implied versus realized volatility relationship broke down as the S&P 500® Index selloff intensified in late February and continued into March. In February, S&P 500® Index realized volatility reached 24.77% and, in March, it spiked to 93.44%, the highest reading in history dating back to 1928. The VIX® averages for February and March were 19.63 and 57.74, respectively.
Source: Bloomberg, L.P.
The Cboe® S&P 500 BuyWriteSM Index (the BXMSM) had a return of -22.22% for the first quarter, underperforming the S&P 500® Index by 262 bps. On the third Friday of each month, the BXMSM wrote a new index call option as the option it wrote the previous month expired. The premiums the BXMSM collects on written options have significant influence on its return potential over a period when the market advances and help to mitigate losses during market declines. Premiums collected as a percentage of the BXM’sSM underlying value were 1.18%, 1.51% and 4.56% in January, February and March, respectively. The increasing premiums reflect the increase in implied volatility over the course of the quarter. With monthly returns of -1.13%, -7.56% and -14.90%, slight outperformance relative to the S&P 500® Index in February did not make up for BXM’sSM underperformance in January and March. The sudden shift from a low- to high-volatility environment and the timing of its option expirations had a significant impact on the BXM’sSM relative return for the quarter. Relatively low option premiums collected in the low volatility periods of December and January limited the BXM’sSM participation in the market advance that began the year. From the beginning of the year through February 19, the BXMSM returned 2.25%, underperforming the 5.08% return of the S&P 500® Index by 283 bps. February expiration came just prior to the shift in market volatility, resulting in relatively little downside protection over the majority of the market’s peak-to-trough drawdown. From February 19 through March 23, the BXMSM returned -30.23%, providing 356 bps of downside protection relative to the S&P 500® Index. The relatively large premium collected by the BXMSM on March 20 helped improve downside protection during the last two days of the market’s drawdown, however, the return potential provided by the BXM’sSM March premium was small relative to the strong market advance at the end of the quarter. From March 23 through quarter end, the BXMSM returned 9.01%, lagging the S&P 500® Index by 656 bps.
Source: Bloomberg, L.P. Performance data shown represents past performance and is no guarantee of, and not necessarily indicative of, future results.
The Bloomberg Barclays U.S. Aggregate Bond Index (the Agg) returned 3.15% in the first quarter of 2020, benefiting from a drastic decline in interest rates. The yield on the 10-year U.S. Treasury Note (the 10-year) started the first quarter at its intra-quarter high of 1.92% and ended the quarter significantly lower at 0.67%. On March 9, the yield on the 10-year declined to an intra-quarter low of 0.54% before briefly spiking to 1.19% on March 18. These swings demonstrated that the bond market was not immune from volatility and losses as, from March 9 through March 19, the Agg declined 6.30%. On the shorter-end of the yield curve, investors witnessed yields dip into negative territory, with one-month U.S. Treasury Notes yielding -0.17% on March 25 before ending the quarter in positive territory.
1The BXMSM is a passive total return index designed to track the performance of a hypothetical buy-write strategy on the S&P 500® Index. The construction methodology of the index includes buying an equity portfolio replicating the holdings of the S&P 500® Index and selling a single one-month S&P 500® Index call option with a strike price approximately at-the-money each month on the Friday of the standard index-option expiration cycle and holding that position until the next expiration.