The S&P 500® Index returned 8.74% in the second quarter of 2023 with monthly returns of 1.56%, 0.43% and 6.61% for April, May and June, respectively. There was much handwringing about the future path of the Federal Reserve’s (the Fed) policies to slow the economy and bring down inflation from record heights during the second quarter of 2023. Hopes for a pause, or even a reversal, in the Fed’s hiking cycle drove markets higher and held volatility lower during the quarter as economic results suggested a new era of monetary policy was showing signs of progress. On May 3, the Fed signaled such hopes could materialize – after increasing the Fed funds rate by 25 basis points (bps) to a target range of 5.00% – 5.25%. Then, in June, the Fed paused. Investors seemingly picked up the signal in May, however. The S&P 500® Index began a 9.91% climb on May 4 that lasted through quarter-end.
In light of the Fed’s persistent efforts in attempting to control inflation, data released in June showed a resilient but cooling U.S. economy. The third estimate of Gross Domestic Product for the first quarter of 2023 showed that the U.S. continued to grow by an annualized rate of 2.0%, above the consensus expectation of 1.4% and continuing an upward trend. The May unemployment rate of 3.7% was an increase from the prior month and worse than the consensus estimate, while the participation rate held steady at 62.6%. The May Consumer Price Index, released June 13, showed a year-over-year increase of 4.0%, slightly lower than the consensus expectation and continuing a downward trend. First quarter aggregate operating earnings were on track to climb more than 1.6% quarter-over-quarter while decreasing nearly 4.8% year-over-year. With over 99% of S&P 500® Index companies reporting, almost 80% met or exceeded analyst estimates.
Implied volatility, as measured by the Cboe® Volatility Index (the VIX®), averaged 16.44 in the second quarter. Consistent with its typical relationship, average implied volatility exceeded realized volatility, as measured by the standard deviation of daily returns for the S&P 500® Index, which was 11.88% for the quarter. The VIX® ended the first quarter at 18.70 before climbing to a second quarter high of 20.09 on May 4. Progress on inflation, Fed decisions and the start of summer vacations contributed to the VIX® declining to a second quarter low of 12.91 on June 22. The VIX® closed the quarter at 13.59.
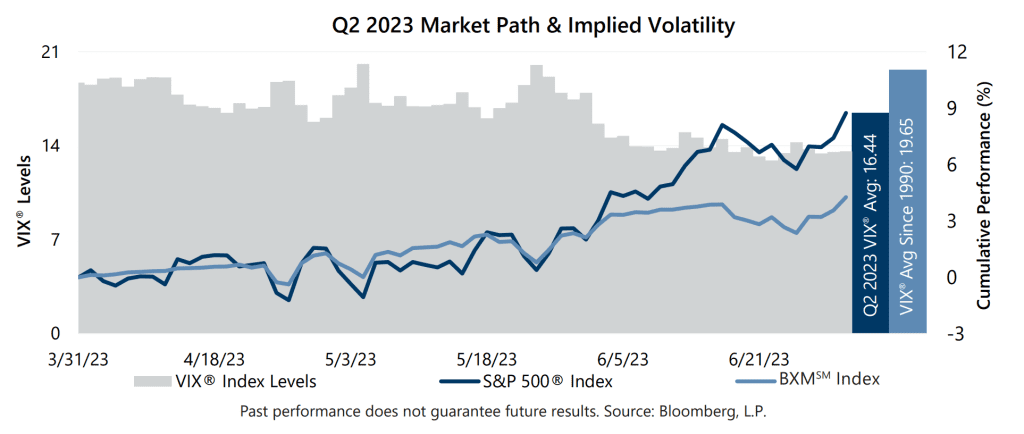
The Cboe® S&P 500 BuyWriteSM Index1 (the BXMSM) returned 4.26% in the second quarter, underperforming the S&P 500® Index by 448 bps. The BXMSM returned 1.15%, 0.96% and 2.10% in April, May and June, respectively. The BXMSM is a hypothetical S&P 500® Index buy-write strategy which purchases (buys) an equity portfolio replicating the S&P 500® Index and sells (writes) a single one-month S&P 500® Index call option with a strike price approximately at-the-money. On the third Friday of each month, the BXMSM writes a new index call option as the option it wrote the previous month expires. This passive, rules-based approach makes the BXMSM return subject to the equity market’s path, and the premiums that the BXMSM collects on its written index call options have significant influence on its return potential. The premiums the BXMSM collected as a percentage of the BXM’sSM underlying value were 1.85%, 1.38% and 1.60% in April, May and June, respectively. As the equity market advanced through the quarter, the BXM’sSM passive approach tended to result in reduced market exposure due to its frequently in-the-money written index call option. Paired with the time premium collected from its written index call option, the BXMSM returned -1.13%, providing 145 bps of downside mitigation during the S&P 500® Index second quarter max drawdown of -2.58% from April 30 to May 4. As the equity market rapidly advanced after May 4, the BXM’sSM rules-based approach was unable to keep pace, returning 4.25% from May 4 through quarter-end relative to the S&P 500® Index return of 9.91%.
The Bloomberg U.S. Aggregate Bond Index returned -0.84% in the second quarter as interest rates resumed their climb following a brief and shallow retreat in response to the threat of a regional banking crisis. The yield on the 10-year U.S. Treasury Note (the 10-year) ended the first quarter at 3.47% before drifting to an intra-quarter low of 3.31% in early April. The 10-year yield rose throughout the quarter to finish June at an intra-quarter high of 3.84%. The yield on the 2-year U.S. Treasury Note exceeded that of the 10-year for the entire quarter, an inversion of its typical relationship that has persisted since July 5, 2022.
1The BXMSM is a passive total return index designed to track the performance of a hypothetical buy-write strategy on the S&P 500® Index. The construction methodology of the index includes buying an equity portfolio replicating the holdings of the S&P 500® Index and selling a single one-month S&P 500® Index call option with a strike price approximately at-the-money each month on the Friday of the standard index-option expiration cycle and holding that position until the next expiration.
Sources: Morningstar DirectSM, Bloomberg, L.P. Performance data shown represents past performance and is no guarantee of, and not necessarily indicative of, future results.
For more information and access to additional insights from Gateway Investment Advisers, LLC, please visit www.gia.com.