The S&P 500® Index returned -16.10% for the second quarter of 2022, bringing its year-to-date return to -19.96%. There were few silver linings during the quarter as the S&P 500® Index posted monthly returns of -8.72%, 0.18% and -8.25% in April, May and June, respectively. Record-high inflation persisted, accelerating the Federal Reserve’s monetary tightening schedule and souring investor sentiment, resulting in a 19.69% decline for the S&P 500® Index from April 4 to June 16, at which point the market officially entered a bear market. From its 2022 peak on January 3 through its new year-to-date low on June 16, the S&P 500® Index declined 22.99%.
U.S. macroeconomic data released in June reflected a difficult macroeconomic environment. The third estimate of Gross Domestic Product for the first quarter of 2022 showed that the U.S. contracted by an annualized rate of 1.6%, slightly worse than the consensus expectation of a 1.4% contraction for the quarter. The unemployment rate was slightly higher than the consensus estimate, holding steady at 3.6% from April to May, while the participation rate ticked up to 62.3%. The May Consumer Price Index, released June 10, continued its record-breaking streak with a year-over-year increase of 8.6%, which was its highest reading for 2022 and above the consensus expectation. First quarter aggregate operating earnings were on track to climb just 0.9% quarter-over-quarter while increasing nearly 40% year-over-year. With over 99% of companies reporting, nearly 80% met or exceeded analyst estimates.
Implied volatility, as measured by the Cboe® Volatility Index (the VIX®), averaged 27.40 in second quarter of 2022. With half of the days in the second quarter featuring S&P 500® Index moves of 1% or greater, including a 4.02% plunge on May 18 and a 3.06% rally on June 24, realized volatility reached 28.32% for the quarter – as measured by the standard deviation of daily returns for the S&P 500® Index – the highest reading since the second quarter of 2020. The implied volatility response to the large daily moves was relatively muted resulting in second quarter realized volatility exceeding implied volatility for the first time since the first quarter of 2020. The VIX® opened the quarter at 19.63, near its intra-month low of 18.57 on June 4, then climbed to an intra-quarter high of 34.75 on May 9. The VIX® ended the quarter at 28.71.
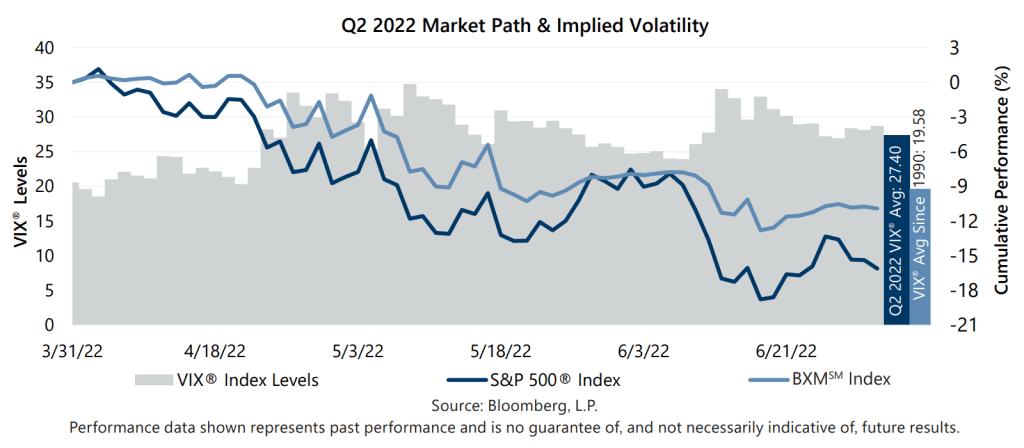
The Cboe® S&P 500 BuyWriteSM Index1 (the BXMSM) returned -10.92% in second quarter of 2022, outperforming the S&P 500® Index by 518 basis points (bps) and bringing its year-to-date return to -10.19%. With monthly returns of -4.72%, -3.73% and -2.88%, outperformance relative to the S&P 500® Index in April and June eclipsed underperformance in May. The BXMSM also provided 640 bps of downside risk mitigation relative to the S&P 500® Index during its drawdown from April 4 through June 16 with a return of -13.29. On the third Friday of each month, the BXMSM writes a new index call option as the option it wrote the previous month expires. The premiums the BXMSM collects on its written index call options have significant influence on its return potential during market advances and help to mitigate market declines. The well-above-average implied volatility throughout the quarter was reflected in the relatively high premiums collected in the second quarter. The premiums the BXMSM collected as a percentage of the BXM’sSM underlying value were 2.09%, 2.53% and 3.32% in April, May and June, respectively. While the premiums collected by the BXMSM during the quarter provided consistent downside protection, the timing of the replacement of its written option in May limited its participation in the equity market’s brief month-end rally, resulting in underperformance for the month. From the beginning of the month through May 19, the day prior to the expiration of its written call option, the BXMSM returned -5.24%, while the S&P 500® Index returned -5.47%. On May 20, the BXMSM wrote a new index call option with a June expiration and a portion of the premium it received contributed to the return of the BXMSM over the remainder of the month but it was insufficient to keep pace with the advance of the equity market. The BXMSM returned 1.59% from its closing value on May 19 through month-end, while the S&P 500® Index rallied 5.98% over the same period.
The Bloomberg U.S. Aggregate Bond Index returned -4.69% in the second quarter, its second consecutive quarterly decline, bringing its year-to-date return to -10.35%. The yield on the 10-year U.S. Treasury Note (the 10-year) started the quarter at its intra-quarter low of 2.38% then rose to an intra-quarter high of 3.47% on June 14, at which time the yield curve was slightly inverted. The 10-year ended the quarter with a yield of 3.01%.
1The BXMSM is a passive total return index designed to track the performance of a hypothetical buy-write strategy on the S&P 500® Index. The construction methodology of the index includes buying an equity portfolio replicating the holdings of the S&P 500® Index and selling a single one-month S&P 500® Index call option with a strike price approximately at-the-money each month on the Friday of the standard index-option expiration cycle and holding that position until the next expiration.
Sources: Morningstar DirectSM, Bloomberg, L.P. Performance data shown represents past performance and is no guarantee of, and not necessarily indicative of, future results.
For more information and access to additional insights from Gateway Investment Advisers, LLC, please visit www.gia.com.