The S&P 500® Index returned 8.55% in the second quarter, bringing its year-to-date return to 15.25%. The strong quarter had a pause in the middle as monthly returns came in at 5.34%, 0.70% and 2.33% for April, May and June, respectively. The advance was supported by ongoing stabilization and improvement in macroeconomic data paired with additional fiscal stimulus in the U.S. The equity market’s rally was invariably interrupted throughout the quarter by renewed concerns regarding the outlook for inflation, ongoing labor market imbalances and the potential for rising interest rates. These issues led to brief S&P 500® Index drawdowns of 3.99% from May 7 through May 12 and 2.07% from June 14 to June 18.
Macroeconomic data released throughout the quarter reflected a recovering domestic economy as the negative effects of pandemic mitigation efforts began to fade and exposed the remaining progress yet to be made. The third estimate of Gross Domestic Product for the first quarter of 2021 showed that the U.S. grew at an annualized rate of 6.4%, matching the consensus expectation. The unemployment rate declined from 6.1% in April to 5.8% in May, just below the consensus expectation, while the participation rate ticked down to 61.6%. Inflation came in much higher than expected, as the May Consumer Price Index, released on June 10, showed a 5.0% year-over-year increase which was above the consensus estimate for the second month in a row. With over 98% of companies reporting, first quarter aggregate operating earnings were on track to climb nearly 23% quarter-over-quarter while increasing 8.40% year-over-year. More than 88% of the companies that reported earnings met or exceeded analyst estimates.
Implied volatility, as measured by the Cboe® Volatility Index (the VIX®), averaged 18.00 in the second quarter of 2021. Consistent with its normal relationship, average implied volatility exceeded realized volatility, as measured by the standard deviation of daily returns for the S&P 500® Index, which was 11.16% for the quarter. Implied volatility was generally rangebound over the period. The VIX® began the second quarter of 2021 at 17.33, reached an intra-quarter high of 27.59 on May 12 and an intra-quarter low of 15.62 on June 25. The VIX® closed the second quarter at 15.83.
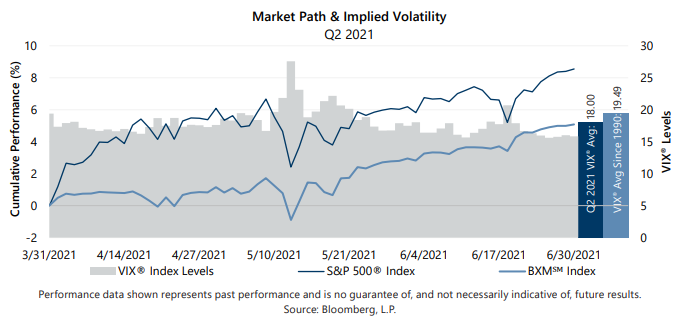
The Cboe® S&P 500 BuyWriteSM Index1 (the BXMSM) returned 5.08% in the second quarter of 2021, underperforming the S&P 500® Index by 347 basis points (bps) and bringing its year-to-date return to 11.10%. With monthly returns of 0.81%, 1.94% and 2.25% in April, May and June, respectively, underperformance relative to the S&P 500® Index in April was the main driver of the BXMSM underperformance for the quarter. On the third Friday of each month, the BXMSM writes a new index call option as the option it wrote the previous month expires. The premiums the BXMSM collects on its written index call options have significant influence on its return potential during equity market advances and help to mitigate market declines. The premiums the BXMSM collected as a percentage of the BXMSM underlying value were 1.51%, 1.36% and 1.58% in April, May and June, respectively. The BXMSM underperformance in April was due in part to equity market action in March. With a strong market advance during the final week of March, the BXMSM entered April with very little equity market exposure and time premium to earn remaining on its call option that was written in March. From the beginning of April through April 15, the BXMSM could not keep pace with the rapid advance of the equity market as the BXMSM 0.88% return lagged the S&P 500® Index by 415 bps during this time period. The premiums the BXMSM collected in April and May helped it generate a higher return over the remainder of the quarter. From April 15 through June 30, the BXMSM returned 4.16%, outperforming the 3.35% return of the S&P 500® Index by 81 bps.
The Bloomberg Barclays U.S. Aggregate Bond Index returned 1.83% in the second quarter of the year as interest rates trended down from the levels witnessed in the first quarter of 2021. The yield on the 10-year U.S. Treasury Note (the 10- year) started the quarter at 1.67%, reached its intra-quarter high of 1.72% on April 2, then drifted to its intra-quarter low of 1.43% on June 10. The 10-year ended the quarter with a yield of 1.47%.
1The BXMSM is a passive total return index designed to track the performance of a hypothetical buy-write strategy on the S&P 500® Index. The construction methodology of the index includes buying an equity portfolio replicating the holdings of the S&P 500® Index and selling a single one-month S&P 500® Index call option with a strike price approximately at-the-money each month on the Friday of the standard index-option expiration cycle and holding that position until the next expiration.
Sources: Morningstar DirectSM, Bloomberg, L.P. Performance data shown represents past performance and is no guarantee of, and not necessarily indicative of, future results.
For more information and access to additional insights from Gateway Investment Advisers, LLC, please visit www.gia.com.