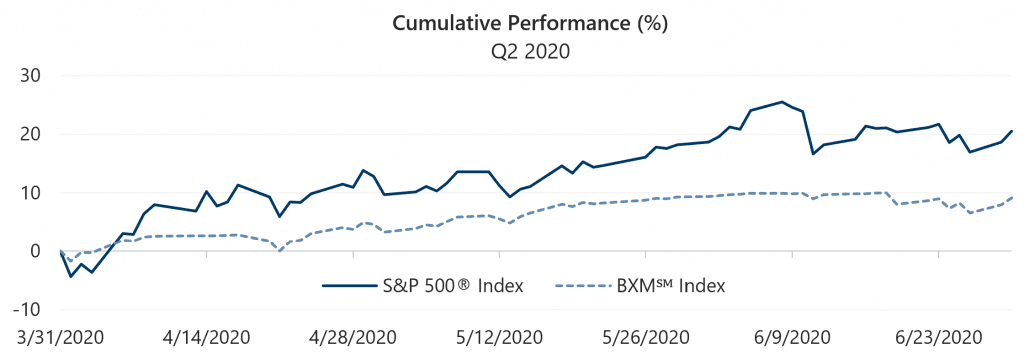
The S&P 500® Index returned 20.54% in the second quarter, bringing its year-to-date return to -3.08%. The strong advance was driven by macroeconomic data that was starkly negative, but better than expected, as individual states began to roll back some COVID-19 mitigation efforts. The S&P 500® Index had a positive return in each month of the quarter with returns of 12.82%, 4.76% and 1.99% in April, May and June, respectively. Though the strong advance was relatively steady, it came with above average volatility and several instances of daily declines exceeding 2%, including a one-day drop of 5.88% on June 11. Despite its highest quarterly return since the fourth quarter of 1998, the S&P 500® Index remained significantly below its first quarter 2020 peak. At the end of the second quarter, after rallying 39.31% from its March 23 low, the S&P 500® Index was 7.77% below its all-time high set on February 19.
Macroeconomic data reflected a partial rebound from the negative effects of COVID-19 mitigation efforts. U.S. Gross Domestic Product growth for the first quarter of 2020 came in at -5.0%, in line with consensus estimates. The unemployment rate declined from 14.7% in April to 13.3% in May, far below the consensus estimate of 19.8%, as the employment participation rate ticked up to 60.8%. The May Consumer Price Index, released on June 10, showed a 0.1% year-over-year increase, slightly below consensus estimates of 0.2%. Corporate earnings reflected challenges posed by COVID-19. With more than 99% of companies reporting, first quarter aggregate operating earnings growth declined 11.77% quarter-over-quarter and declined 9.42% year-over-year. Of the companies that have reported earnings, 70% met or exceeded analyst expectations.
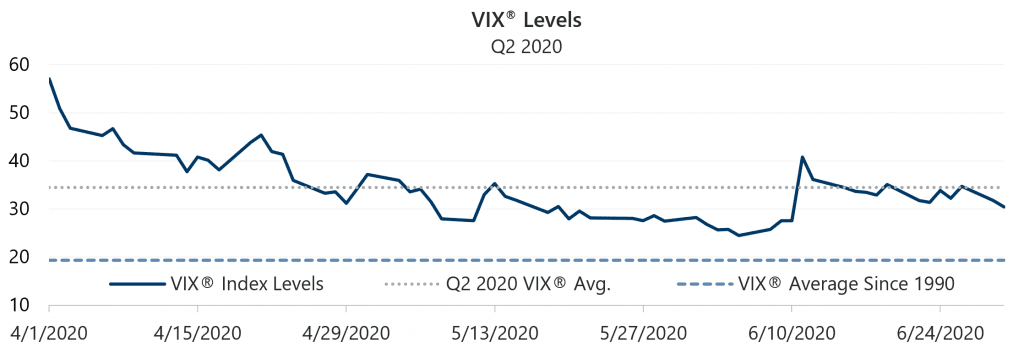
Implied volatility, as measured by the Cboe® Volatility Index (the VIX®), averaged 34.49 in the second quarter of 2020. Consistent with its normal relationship, average implied volatility exceeded realized volatility, as measured by the standard deviation of daily returns for the S&P 500® Index, which was 31.84% for the quarter. Implied volatility generally trended down over the period, continuing to moderate from extreme levels witnessed in the first quarter of 2020. The VIX® began the second quarter of 2020 at an intra-quarter high of 57.06 and reached an intra-quarter low of 24.52 on June 5. The VIX® closed the second quarter at 30.43, still well above its historical average of 19.37.
Source: Bloomberg, L.P.
The Cboe® S&P 500 BuyWriteSM Indexi (the BXMSM) returned 9.14% in the second quarter of 2020, underperforming the S&P 500® Index by 11.40 percentage points and bringing its year-to-date return to -15.11%. On the third Friday of each month, the BXMSM writes a new index call option as the option it wrote the previous month expires. The premiums the BXMSM collects on its written index call options have significant influence on its return potential over a period when the market advances and help to mitigate market declines. Premiums collected as a percentage of the BXM’sSM underlying value were 3.61%, 3.50% and 2.50% in April, May and June, respectively. The decreasing premiums reflect the decline in implied volatility over the course of the second quarter. With monthly returns of 4.64%, 4.43% and -0.12% for April, May and June, respectively, the BXMSM underperformed the S&P 500® Index in all three months with most of the underperformance occurring in April. The premiums collected by the BXMSM in March and April were not enough to keep pace with early April’s rapid equity market advance. Most of the BXM’sSM April return was generated early in the month as it earned the remainder of the premium collected from the index call option written in March. From the beginning of the month through April 8, the BXMSM returned 2.42% while the S&P 500® Index advanced 6.46%. The equity market’s rapid advance put the BXM’sSM April index call option deep in-the-money, resulting in very low market exposure and little return potential as the market continued to trend up. From its closing value on April 8 through April 17, the expiration date of its option, the BXMSM returned 0.41% while the S&P 500® Index returned 4.57%. After mid-April, the rate of the equity market’s advance slowed and the premiums the BXMSM collected in April, May and June allowed it to capture a larger portion of the market’s return. From its closing value on April 17 through June 30, the BXMSM retuned 6.12% while the S&P 500® Index returned 8.28%.
Source: Bloomberg, L.P.
Performance data shown represents past performance and is no guarantee of, and not necessarily indicative of, future results.
The Bloomberg Barclays U.S. Aggregate Bond Index returned 2.90% in the second quarter of 2020, bringing its year-to-date return to 6.14%. The yield on the 10-year U.S. Treasury Note (the 10-year) started the quarter at 0.58% and reached an intra-quarter low of 0.57% on April 21 before climbing to an intra-quarter high of 0.90% on June 5. The 10-year closed the quarter at 0.66%.
1The BXMSM is a passive total return index designed to track the performance of a hypothetical buy-write strategy on the S&P 500® Index. The construction methodology of the index includes buying an equity portfolio replicating the holdings of the S&P 500® Index and selling a single one-month S&P 500® Index call option with a strike price approximately at-the-money each month on the Friday of the standard index-option expiration cycle and holding that position until the next expiration.