Investors who seek to reduce equity market exposure while accessing the potential risk-adjusted, return-enhancing benefits of the option market’s propensity to overprice future volatility can choose between index covered call writing and cash-secured index put writing. The historical outcomes of simple implementations of these two approaches are illustrated by the Cboe® S&P 500 BuyWriteSM Indexi (the BXMSM) and the Cboe® S&P 500 PutWriteSM Indexii (the PUTSM). The historical returns of the two option-writing indexes suggest that writing index put options has clear advantages over writing index call options. However, a deeper look reveals that some small, but consequential, details of each index’s construction methodology have a large impact on their respective outcomes.
Theory and Practice
Models based on standard option pricing theory project identical returns from holding cash and writing one-month, ATM index put options and owning the equity index and writing one-month ATM index call options.
As a practical matter, however, the PUTSM has generated better long-term returns than the BXMSM. In fact, for the last 30 years, the PUTSM has outperformed the BXMSM by more than one percentage point (annualized) while the two indexes have exhibited a similar standard deviation. Over the same period, the PUTSM outperformed the BXMSM nearly 55% of the time on a monthly basis. In June 2020, the PUT’sSM result was particularly strong as it returned a 1.04% gain compared to the BXM’sSM loss of 0.12% for the month.
It Happened on a Friday
The respective outcomes of the two option-writing indexes for the month of June were determined almost solely by one day, June 19, when BXM’sSM decline of 1.75% was 109 basis points (bps) lower than the PUT’sSM decline of 0.66%. This is only somewhat unusual. A one-day return differential greater than 100 bps for the two indexes is a very rare occurrence. This oddity has happened just 28 times in the last 30 years—that is less than one-half of one percent of all days the equity market has been open in those same 30 years. The size of the June 19 differential was unusual, but the timing was not. It was not unusual that it happened on a Friday, and specifically on the third Friday of the month, which is the standard expiration day for the monthly options written by the BXMSM and the PUTSM. Of the 28 one-day return differentials exceeding 1%, 23 of them occurred on an expiration Friday.
An examination of daily return differentials between the BXMSM and the PUTSM shows that Fridays tend to be outliers relative to other days of the week across several metrics. Fridays have had larger return differentials on average, the largest single return differentials have occurred on Fridays, and the standard deviation of Friday returns is at least twice as high as the standard deviations of the other weekdays. Conversely, the statistics for Tuesday through Thursday show the returns of the two indexes are on average, nearly identical, much closer to what standard option pricing models would predict.
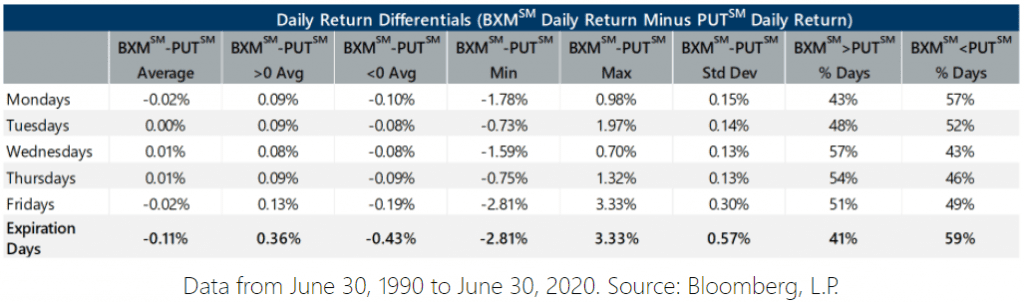
Isolating the return differentials on days in which the options written by the two indexes expire (nearly all standard expirations are on Fridays, with the rare exceptions being when the third Friday of the month is a holiday, in which case expiration is on the preceding Thursday), shows that these are the days that produced the most variation in return differential. There are two scenarios that can occur on expiration days that have the potential to significantly impact the relative returns of the BXMSM and the PUTSM. The index’s respective returns on June 19 provide an opportunity to examine the impact of both. The first factor is how the expiration price of standard index options is determined. The second is the timeframe over which the new options written by the BXMSM and the PUTSM are priced and established. Chart 1 illustrates all these factors against a timeline of S&P 500® Index price changes on June 19.
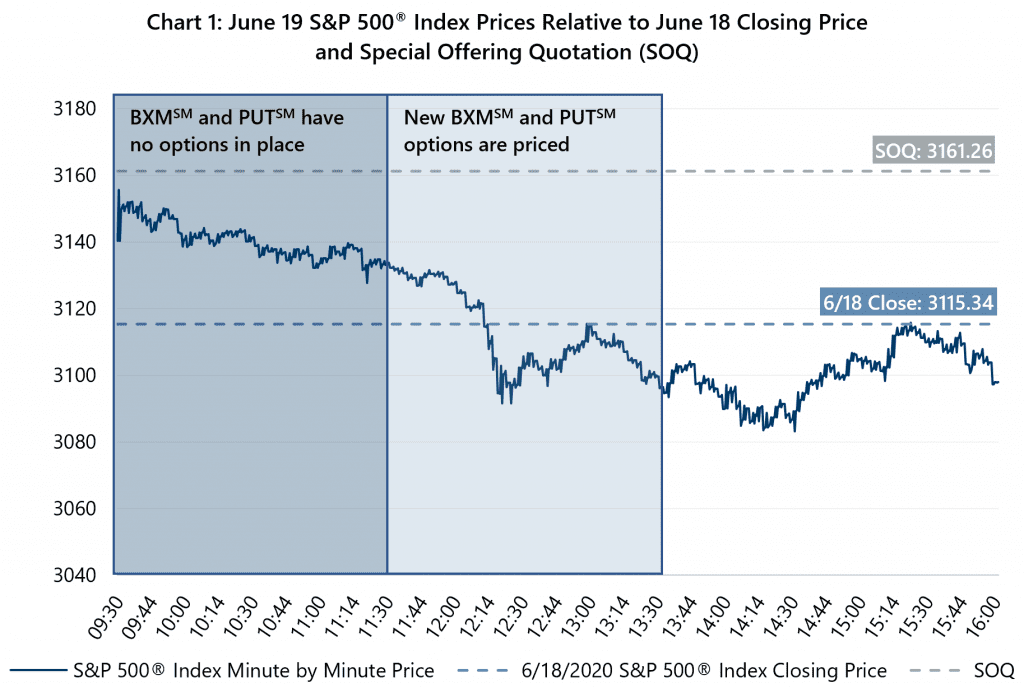
The expiration price of standard index options is determined by the Special Offering Quotation (SOQ) rather than the price of the S&P 500® Index at the opening or closing bell on expiration day. The SOQ is computed by summing the opening prices of each individual company in the S&P 500® Index. The SOQ can vary significantly from the price of the S&P 500® Index at the opening bell if a significant portion of the index has a delayed opening. On June 19, the SOQ was calculated as 3161.26, nearly 46 points higher than the closing value of the S&P 500® Index on June 18. With a strike price of 2835, the BXM’sSM expiring contract was already in-the-money so the elevated SOQ increased the price of its written index call option by over $46, detracting approximately 1.45% from the BXM’sSM return. The PUTSM‘s expiring index put option contract, on the other hand, had a strike price of 2830, which was significantly out-of-the-money and, therefore, the contract would be worth zero at expiration. In short, the SOQ had a large negative impact on the BXMSM and no impact on the PUTSM.
The second factor that can impact the relative returns of the BXMSM and the PUTSM is indicated by the shading on Chart 1. For the first two hours of equity market operations on the third Friday of each month, the BXMSM and the PUTSM have no written options in place. This leaves each index without one of its two components and results in the BXM’sSM return during that window of time being solely a function of the change in S&P 500® Index price while the PUT’sSM return is solely a function of the price change of its U.S. Treasury bill portfolio. Over the next two hours (from 11:30 a.m. to 1:30 p.m.), the new options written by the BXMSM and the PUTSM are priced. Equity market volatility in this window will impact relative return of the BXMSM and the PUTSM—falling S&P 500® Index prices will hurt equity market-exposed BXMSM relative to the U.S. Treasury bill-invested PUTSM while rising S&P 500® Index prices will help the BXMSM relative to the PUTSM. On June 19, the decline of the S&P 500® Index from its opening value to mid-afternoon detracted from both the BXMSM’s absolute return and its return relative to the PUTSM for the day.
Implications
The historical returns of the BXMSM and the PUTSM may give a misleading impression of the relative merits of index call writing and index put writing. The frequent occurrence of lower returns for the BXMSM relative to the PUTSM on the days their contracts expire is evidence of opportunities for active managers to add value. Specifically, active managers can trade soon-to-expire contracts in an effort to avoid pricing anomalies created by the SOQ. Additionally, active managers diversify across multiple option contracts with various strike prices and expiration dates, rather than rely on the single contract approach of the BXMSM and the PUTSM, which risks creating windows of time when a strategy has no options in place. These simple, common sense techniques are among the active management elements Gateway Investment Advisers has utilized for decades in its effort to harness the full benefits of writing index options for its clients.
iThe BXMSM is a passive total return index designed to track the performance of a hypothetical buy-write strategy on the S&P 500® Index. The construction methodology of the index includes buying an equity portfolio replicating the holdings of the S&P 500® Index and selling a single one-month S&P 500® Index call option with a strike price approximately at-the-money each month on the Friday of the standard index-option expiration cycle and holding that position until the next expiration.
iiThe PUTSM is a passive total return index designed to track the performance of a hypothetical portfolio that sells S&P 500® Index put options against collateralized cash reserves held in a money market account. The PUTSM strategy is designed to sell a monthly sequence of S&P 500® Index puts and invest cash at one- and three-month Treasury Bill rates. The monthly sequence entails writing one-month S&P 500® Index put options with a strike price approximately at-the-money each month on the Friday of the standard index option expiration cycle and holding that position until the next expiration. The number of put contracts with identical strike prices and expiration dates sold varies from month to month but is limited so that the amount held in Treasury Bills can finance the maximum possible loss from final settlement of the S&P 500® Index puts.