Implied volatility, as measured by the Cboe® Volatility Index (the VIX®), averaged 13.93 in July. Consistent with its typical relationship, average implied volatility exceeded realized volatility, as measured by the standard deviation of daily returns for the S&P 500® Index, which was 8.03% for the month. The VIX® ended June at 13.59, reached an intra-month high of 15.44 on July 6, then drifted to an intra-month low of 13.19 on July 26. The VIX® closed the month at 13.63.
The Volatility Risk Premium (VRP) is the difference between the average closing price of the VIX®, or implied volatility, and the realized volatility for the S&P 500® Index. July’s 5.90 percentage-point spread between the two statistics was well-above the 4.1% historical average and was the second highest reading for 2023.
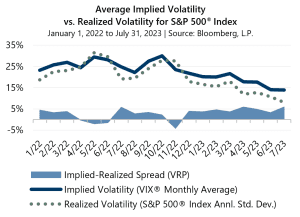 Through July, the VRP has exceeded its historical average during more than half of the year, averaging 4.53%. This is a clear shift higher when compared to 2022, during which the VRP averaged just 1.79%. The narrowing of the VRP in 2022 was driven by significantly elevated realized volatility as equity markets entered bear market territory and faced several headwinds. Investors witnessed realized volatility levels that had not been seen since the onset of the pandemic in 2020 which caused the VRP to invert multiple times. So far this year, at its narrowest (and positive) point, VRP was 3.25% in June. This compares to a positive low of 2.17% in 2022.
VRP is frequently positive and often above its long-term average. Since the inception of the VIX® in January 1990, the VRP has been positive in nearly 89% of months and above the long-term average more than half of the time. Strategies that sell (write) index options, such as those managed by Gateway, can provide a potential source of improved risk-adjusted return by monetizing this consistent overpricing implied volatility.