The S&P 500® Index returned 3.21% in July, bringing its year-to-date return to 20.65% which ranked as its fourth best start in 35 years. From its 2023 low on January 5, the S&P 500® Index has climbed 21.61% – an unexpected, and not exactly smooth, but welcomed surprise. As 2022 came to a close, a majority of economists and investment strategists, surveyed by Natixis Investment Managers’ Center for Investor Insight*, believed recession was inevitable in 2023. Forecasts often misalign with actual outcomes. The July equity market advance was fueled by economic data that continued to be resilient and the U.S. Federal Reserve (the Fed), who met expectations of an interest rate increase.
Macroeconomic data released in July reflected progress in the Fed’s efforts to bring down inflation while also showing a resiliency that was unexpected at the start of the year. The first estimate of Gross Domestic Product for the second quarter of 2023 showed that the U.S. grew at a rate of 2.4%, above the consensus expectation of 1.8%. The June unemployment rate of 3.6% was a decline from the prior month and matched the consensus estimate, while the participation rate continued at 62.6% for the fourth consecutive month. Continuing its monthly decline from a July 2022 peak of 9.1%, the June 2023 Consumer Price Index, released July 12, showed a year-over-year increase of 3.0%, lower than the prior month and slightly below the consensus expectation. Second quarter aggregate operating earnings were on track to increase 2.2% quarter-over-quarter while decreasing -0.2% year-over-year. With just over 52% of S&P 500® Index companies reporting, nearly 83% have met or exceeded analyst estimates.
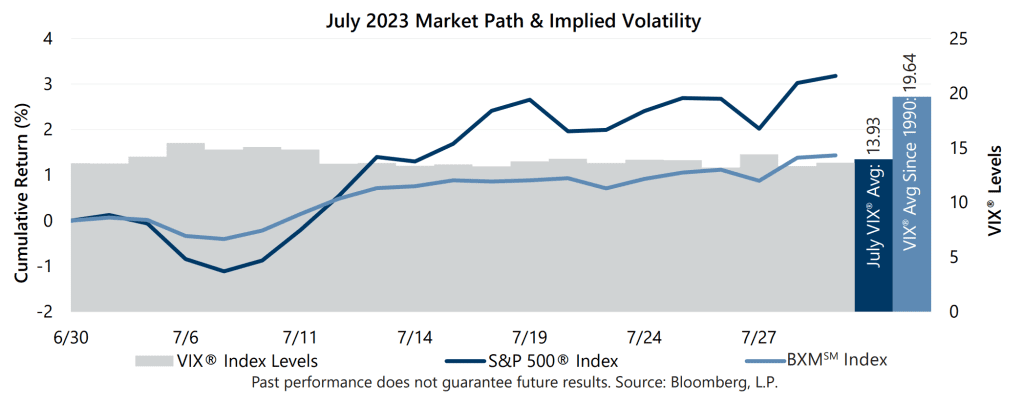
Implied volatility, as measured by the Cboe® Volatility Index (the VIX®), averaged 13.93 in July. Consistent with its typical relationship, average implied volatility exceeded realized volatility, as measured by the standard deviation of daily returns for the S&P 500® Index, which was 8.03% for the month. The 5.90 percentage-point spread between realized volatility and average implied volatility was well-above the 4.1% historical average. The VIX® ended June at 13.59, reached an intra-month high of 15.44 on July 6, then drifted to an intra-month low of 13.19 on July 26. The VIX® closed the month at 13.63.
The Cboe® S&P 500 BuyWriteSM Index1 (the BXMSM) returned 1.43% in July, bringing its year-to-date return to 12.05%. The BXMSM is an S&P 500® Index buy-write strategy which purchases (buys) an equity portfolio replicating the S&P 500® Index and sells (writes) a single one-month S&P 500® Index call option with a strike price approximately at-the-money. On the third Friday of each month, the BXMSM writes a new index call option as the option it wrote the previous month expires. This passive, rules-based approach makes the BXMSM return subject to the equity market’s path, and the premiums that the BXMSM collects on its written index call options have significant influence on its return potential. The BXMSM began the month with an in-the-money written index call option due to the market advance during June, leading to relatively low market exposure until it wrote a new index call option with an August expiration on July 21. The premium the BXMSM collected as a percentage of its underlying value was 1.39% in July. Earning a portion of the premium it received contributed to the return of the BXMSM over the remainder of the month but paired with a restrictive rules-based approach, was insufficient in keeping pace with the equity market’s robust advance.
The Bloomberg U.S. Aggregate Bond Index returned -0.07% in July, bringing its year-to-date return to 2.02%. The yield on the 10-year U.S. Treasury Note (the 10-year) ended June at 3.84% before reaching an intra-month high of 4.06% on July 7. The yield on the 10-year then drifted to an intra-month low of 3.75% on July 19, before ending the month at 3.96%. Throughout July, the yield on the 2-year U.S. Treasury Note exceeded that of the 10-year, an inversion of its typical relationship that began on July 5, 2022.
1*Natixis Investment Managers’ Center for Investor Insight, June 2023, Natixis Center for Investor Insight Mid-Year Survey, https://www.im.natixis.com/us/press-release/the-biggest-risk-now-is-complacency-say-strategists-surveyed-by-natixis-investment-managers
2The BXMSM is a passive total return index designed to track the performance of a hypothetical buy-write strategy on the S&P 500® Index. The construction methodology of the index includes buying an equity portfolio replicating the holdings of the S&P 500® Index and selling a single one-month S&P 500® Index call option with a strike price approximately at-the-money each month on the Friday of the standard index-option expiration cycle and holding that position until the next expiration.
Sources: Morningstar DirectSM, Bloomberg, L.P. Performance data shown represents past performance and is no guarantee of, and not necessarily indicative of, future results.
For more information and access to additional insights from Gateway Investment Advisers, LLC, please visit www.gia.com.