The S&P 500® Index returned 2.38% for the month of July, bringing its year-to-date return to 17.99%. After climbing 2.07% from the start of July through July 12, persistent concerns surrounding the outlook for inflation paired with a renewed wave of worry regarding COVID led the S&P 500® Index to decline 2.86% from July 12 through July 19. As investor anxiety subsided, the S&P 500® Index rallied 3.25% from July 19 through month-end.
Macroeconomic data released in July reflected a pause in positive U.S. trends given refreshed concern regarding the negative economic effects of pandemic mitigation efforts. The first estimate of Gross Domestic Product for the second quarter of 2021 showed that the U.S. grew at an annualized rate of 6.5%, much lower than the average consensus expectation of 8.0%. The unemployment rate climbed from 5.8% in May to 5.9% in June, well above the average consensus expectation of 5.6%, while the participation rate held steady at 61.6%. Inflation came in much higher than expected for the fourth consecutive month, as the June Consumer Price Index, released on July 13, showed a 5.4% year-over-year increase, well above the consensus estimate of 5.0%. With over 58% of companies reporting, second quarter aggregate operating earnings were on track to climb nearly 15% quarter-over-quarter while increasing more than 37% year-over-year. More than 90% of the companies that reported earnings met or exceeded analyst estimates.
Implied volatility, as measured by the Cboe® Volatility Index (the VIX®), averaged 17.60 in July. Consistent with its normal relationship, average implied volatility exceeded realized volatility, as measured by the standard deviation of daily returns for the S&P 500® Index, which was 11.76% for the month. July marked the 10th consecutive month that the spread between implied and realized volatility was wider than the historical average. The VIX® opened the month at 15.48 before reaching its intra-month low of 15.07 on July 2. The VIX® then climbed to an intra-month high of 22.50 on July 19 before closing the month at 18.24.
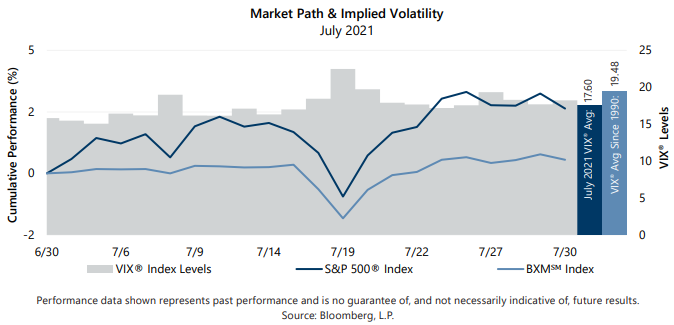
The Cboe® S&P 500 BuyWriteSM Index1 (the BXMSM) returned 0.50% in July, underperforming the S&P 500® Index by 188 basis points (bps) and bringing its year-to-date return to 11.66%. The BXMSM provided downside protection during the mid-month drawdown, but was insufficient in overcoming its underperformance during the rapid equity market advances that began and ended July. On the third Friday of each month, the BXMSM writes a new index call option as the option it wrote the previous month expires. The premiums the BXMSM collects on its written index call options have significant influence on its return potential during market advances and help to mitigate market declines. As the market advanced from the beginning of the month through July 12, the BXMSM earned the remaining portion of time premium from the index call option it wrote in June, which helped it generate a return of 0.26% for the period, underperforming the S&P 500® Index by 181 bps. During the market pullback from July 12 through July 19, the BXMSM returned -1.90%, delivering downside protection and outperforming the S&P 500® Index by 96 bps. The downside protection was driven by a combination of an in-the-money index call option at the beginning of the pullback and receiving a premium on a newly-written index call option on July 16 as its previous contract expired. From July 19 through month-end, earning a portion of time premium from its new index call option with an August expiration helped the BXMSM return 2.18%, though it lagged the return of the S&P 500® Index by 107 bps over the same period.
The Bloomberg Barclays U.S. Aggregate Bond Index returned 1.12% in July, bringing its year-to-date return to -0.50%. The yield on the 10-year U.S. Treasury Note (the 10-year) started July at its intra-month high of 1.46% before drifting to its intra-month low of 1.19% on July 19. The 10-year closed the month at 1.22%.
1The BXMSM is a passive total return index designed to track the performance of a hypothetical buy-write strategy on the S&P 500® Index. The construction methodology of the index includes buying an equity portfolio replicating the holdings of the S&P 500® Index and selling a single one-month S&P 500® Index call option with a strike price approximately at-the-money each month on the Friday of the standard index-option expiration cycle and holding that position until the next expiration.
Sources: Morningstar DirectSM, Bloomberg, L.P. Performance data shown represents past performance and is no guarantee of, and not necessarily indicative of, future results.
For more information and access to additional insights from Gateway Investment Advisers, LLC, please visit www.gia.com.