The S&P 500® Index returned 5.64% for the month of July, bringing its year-to-date return to 2.38%. As portions of the nation began to restart some non-essential business activities after COVID-19 related closures, new hot-spots with increasing case counts faced a fresh round of mitigation efforts. Economic data continued to reflect sharp economic retrenchment, but some data points were better than expected and the employment picture improved. The S&P 500® Index climbed 47.16% from its March 23, 2020 low through July 31, 2020. Despite July’s robust performance, from its all-time high on February 19, 2020 through month-end, the S&P 500® Index remained down 2.57%.
The first estimate of Gross Domestic Product for the second quarter of 2020 showed that the U.S economy shrunk at an annualized rate of -32.9%, slightly better than the consensus estimate of -35.0%. The unemployment rate, reflecting economic reopening efforts, declined from 13.3% in May to 11.1% in June. The June labor participation rate followed suit, improving from 60.8% to 61.5%. The June Consumer Price Index, released on July 14, reflected a 0.6% year-over-year increase, at the top end of consensus expectations. With just over 25% of companies reporting, second quarter aggregate operating earnings were on track to decline 12.66% quarter-over-quarter and 21.65% year-over-year. More than 83% of the companies that have reported earnings met or exceeded analyst estimates.
Implied volatility, as measured by the Cboe® Volatility Index (the VIX®), averaged 26.84 in July. Average implied volatility exceeded realized volatility, as measured by the standard deviation of daily returns for the S&P 500® Index, which came in at 13.28% for the month. The VIX® opened the month at 28.62, touched an intra-month high of 32.19 on July 13, then drifted to an intra-month low of 24.10 on July 29. The VIX® ended the month at 24.46, well below the extreme levels witnessed earlier in the year but remaining significantly above its historical average of 19.39.
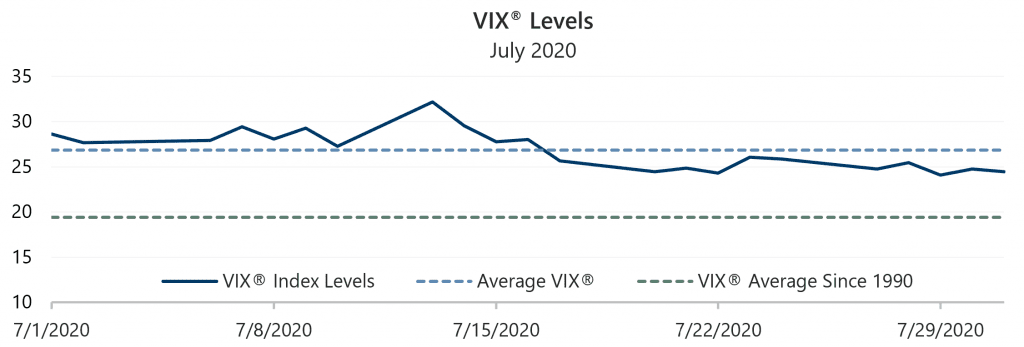
Source: Bloomberg, L.P.
The Cboe® S&P 500 BuyWriteSM Index1 (the BXMSM) returned 3.85% in July, underperforming the S&P 500® Index by 179 basis points and bringing its year-to-date return to -11.84%. On the third Friday of each month, the BXMSM writes a new index call option as the option it wrote the previous month expires. The premiums the BXMSM collects on its written index call options have significant influence on its return potential over a period when the market advances and help to mitigate market declines. The BXM’sSM underperformance relative to the S&P 500® Index was primarily due to the premiums collected by the BXMSM when it wrote index call options on June 19 and July 17 providing insufficient return potential to keep pace with the equity market’s rapid advance. Specifically, the BXMSM generated a return of 2.61% from the beginning of July through July 16 as it earmed the remaining time premium from the index call option it wrote in June. However, this was insufficient to keep pace with the 3.80% advance of the S&P 500® Index over the same period. On July 17, the BXMSM wrote a new index call option with an August expiration as its July option expired and collected a premium of 2.59%, as a percentage of the BXM’sSM underlying value. This premium helped the BXMSM return 1.21% from its closing value on July 16 through month-end, but the BXM’sSM return lagged the 1.78% return of the S&P 500® Index over the same period.
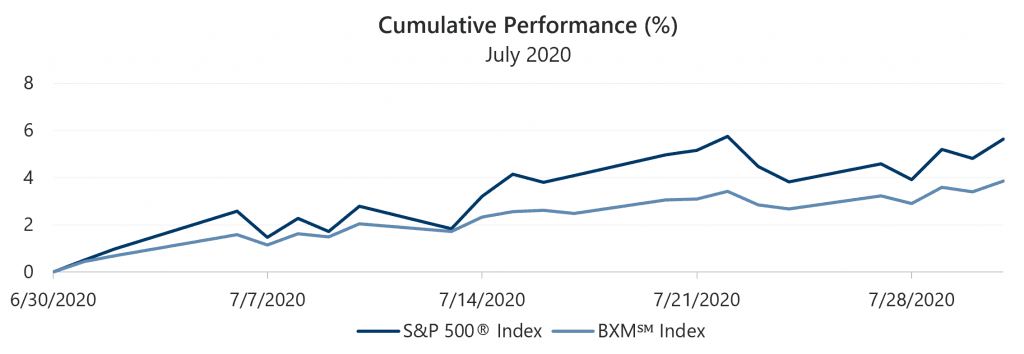
Source: Bloomberg, L.P.
Performance data shown represents past performance and is no guarantee of, and not necessarily indicative of, future results.
The Bloomberg Barclays U.S. Aggregate Bond Index returned 1.49% in July. The yield on the 10-year U.S. Treasury Note (the 10-year) generally declined over the course of July, starting the month at 0.68% before drifting to an intra-month low and monthly close of 0.53%.
1The BXMSM is a passive total return index designed to track the performance of a hypothetical buy-write strategy on the S&P 500® Index. The construction methodology of the index includes buying an equity portfolio replicating the holdings of the S&P 500® Index and selling a single one-month S&P 500® Index call option with a strike price approximately at-the-money each month on the Friday of the standard index-option expiration cycle and holding that position until the next expiration.