Despite the huge contraction in economic activity and corporate profitability during the second quarter of 2020, the U.S. equity market mounted an impressive rally, ending July near all-time highs. From the market low on March 23 through July 31, the S&P 500® Index returned 47.16%. As the market staged its comeback, volatility collapsed from the extreme levels of the first quarter. The S&P 500® Index had an annualized standard deviation of 13.28% for the month of July. This below-average monthly reading was also more than 85% lower than the highest-ever monthly level registered in March – from highest-ever to below-average in the span of four months.
Implied volatility, as measured by the Cboe® Volatility Index (the VIX®), also ended July at a much lower level than its first quarter high, but its decline has not been quite as breathtaking. The VIX® closing value of 24.46 on July 31 was only 70% lower than its highest reading in March.
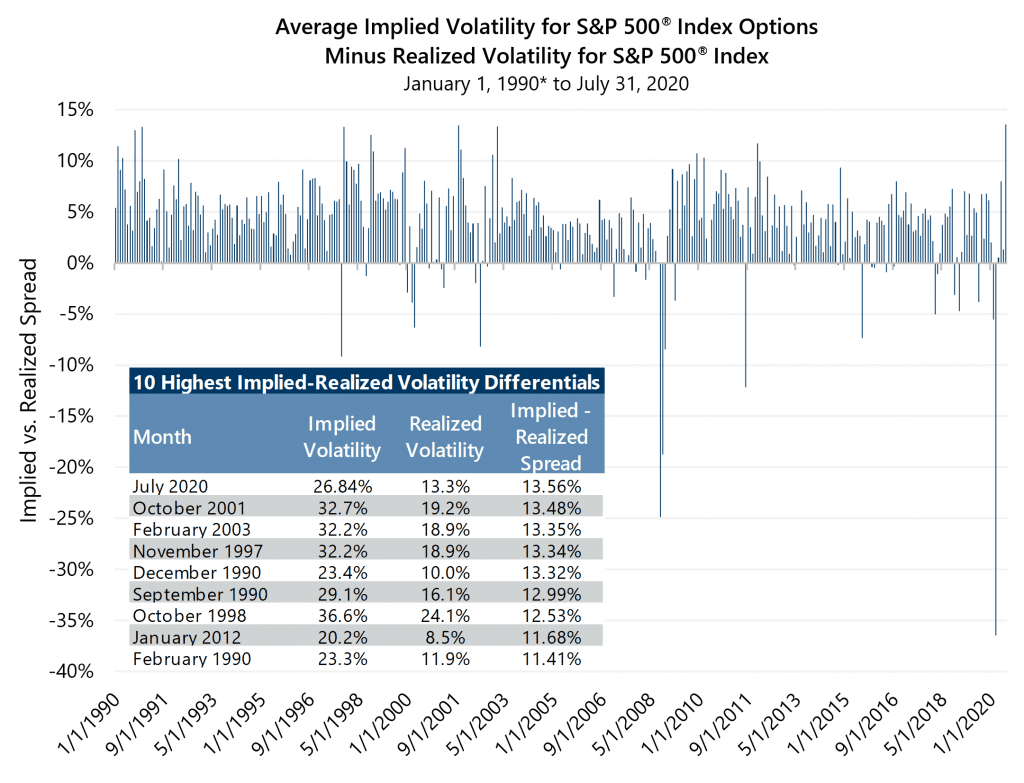
Even though realized volatility and implied volatility had similar trajectories during the market advance, the two statistics ended up in very different places. While realized volatility fell to a below-average reading, the VIX® ended July more than 25% above its long-term average. In fact, for the month of July, average implied volatility was double realized volatility and the two statistics had the largest positive monthly differential in history. The 13.56 percentage point spread between implied and realized volatility was also the first double-digit spread since January 2012.
While implied volatility has come down significantly from the extreme levels witnessed in the first quarter of 2020, it remains well-above its historical average and well-above recent realized volatility, both of which are advantageous for strategies that use index options to enhance risk-adjusted return while lowering the risk of equity market exposure. Above-average implied volatility levels that are also well above realized volatility create strong potential for attractive risk-adjusted returns from option writing strategies.
Higher implied volatility relative to realized volatility is a persistent, but not constant, characteristic of the markets for index options and equities. The recent wider-than-usual spread may be an indication that the collapse in realized volatility may be coincident with increased speculation on future changes in volatility. Some speculators are betting that the current environment is likely to continue and are selling volatility at its current level in hopes that it drops further. Other speculators are betting that the volatility drivers present earlier this year will return and cause a volatility spike. Gateway’s view is that such speculation is just as risky, if not riskier, than speculating on the direction of the equity market.
Gateway’s use of index options to manage equity risk differs from speculation on the future direction of volatility in fundamental ways. While a pure speculator will generate an absolute gain or absolute loss depending on the change in volatility, Gateway’s strategies use index options to consistently reduce the risk of equity market exposure. Higher levels of volatility can lead to higher option premiums and increased cash flow from option selling, but the gain or loss of the strategy as a whole is more dependent on the direction of the equity market than whether volatility is rising or falling. Gateway’s strategies are designed to be a true hedge to the equity market—with the potential to consistently benefit from equity market advances and consistently mitigate the effect of equity market declines. This market agnostic, risk-first approach has generated a low-volatility equity profile that has served our investors well for more than 40 years.
*For more information and access to additional insights from Gateway Investment Advisers, LLC, please visit www.gia.com/insights.