January 2024 Market Recap

January 2024 Market Recap
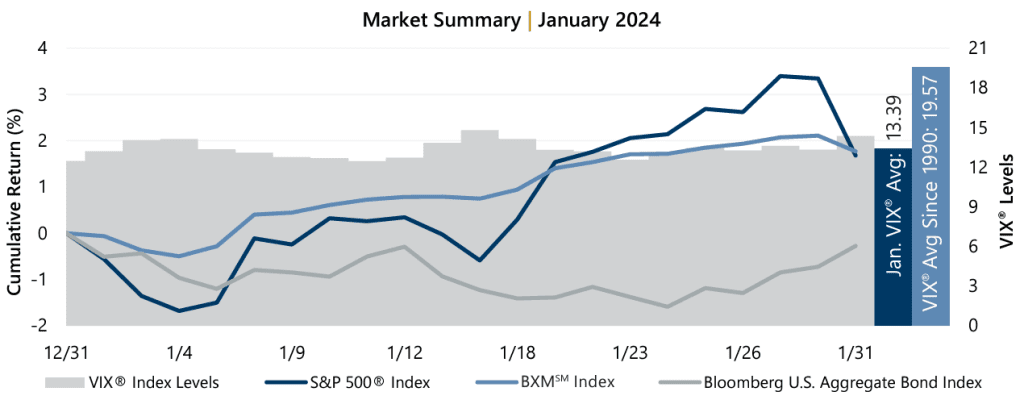
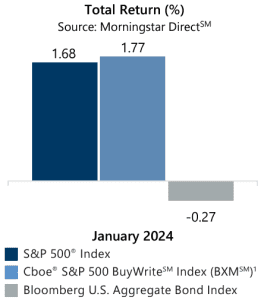
The equity market rally from the end of 2023 carried into January, although not without bumps along the way. From the start of the year to January 4, the equity market declined 1.68% before resilient economic data and ongoing optimism surrounding the expectation for interest rate cuts fueled a 5.16% advance from January 4 through January 29. Month-end comments from the U.S. Federal Reserve (the Fed), however, dampened the outlook for immediate cuts and renewed concerns over monetary policy. This resulted in the S&P 500® Index’s largest daily decline since September 2023 which contributed to a -1.66% decline from January 29 to month-end.

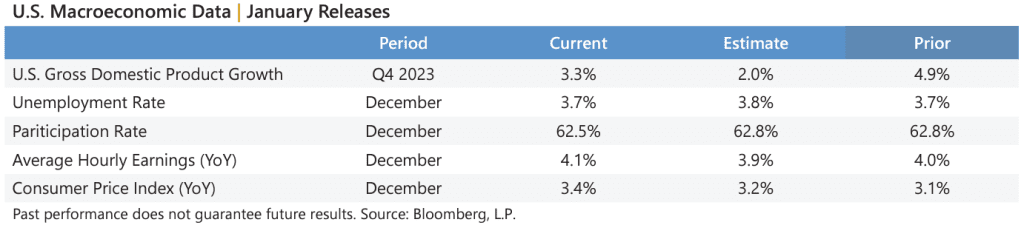
Macroeconomic data released during January showed a resilient economy and stubborn inflation, running contrary to hopes that the Fed would see that its tightening efforts have done plenty to cool the economy and conquer runaway inflation. The first estimate of Gross Domestic Product for the fourth quarter of 2023 showed a deceleration from the prior reading but well above the consensus estimate. Meanwhile, the December Consumer Price Index released January 11 showed an unexpected increase in the year-over-year figure. Corporate earnings reflected continued resilience as well, with fourth quarter aggregate operating earnings on track to climb 1.1% quarter-over-quarter and 7.8% year-over-year. With over 36% of S&P 500® Index companies reporting, nearly 82% met or exceeded analyst estimates.

January 2024 Market Recap

Implied volatility, as measured by the Cboe® Volatility Index (the VIX®), averaged 13.39 in January. Consistent with its typical relationship, average implied volatility exceeded realized volatility, as measured by the standard deviation of daily returns for the S&P 500® Index, which was 11.03% for the month. The VIX® ended December at 12.45 and reached an intra-month low of 12.44 on January 11 before reaching an intra-month high of 14.79 on January 17. The VIX® closed the month at 14.35.

January 2024 Market Recap

The Cboe® S&P 500 BuyWriteSM Index1 (the BXMSM) returned 1.77% in January. The premiums the BXMSM collected as a percentage of its underlying value provided downside loss mitigation which helped to outpace the S&P 500® Index during the month. Specifically, the equity market advance at the end of 2023 resulted in the BXMSM entering 2024 with relatively low market exposure. When paired with the remaining premium from the index call option written in December, the BXMSM’s positioning led to a return of -0.50% during the equity market decline from year-end 2023 to January 4, providing 118 basis points (bps) of loss mitigation relative to the S&P 500® Index return of -1.68%. The BXMSM wrote its new index call option with a February expiration on January 19, resetting its market exposure amidst a rally and collecting a premium of 1.55%. Its passive positioning was beneficial during the equity market decline from January 30 to January 31 during which the BXMSM returned -0.34% relative to the -1.61% return of the S&P 500® Index.

The BXMSM is a hypothetical S&P 500® Index buy-write strategy which purchases (buys) an equity portfolio replicating the S&P 500® Index and sells (writes) a single one-month S&P 500® Index call option with a strike price approximately at-the-money. On the third Friday of each month, the BXMSM writes a new index call option as the option it wrote the previous month expires. This passive, rules-based approach makes the BXMSM return subject to the equity market’s path, and the premiums that the BXMSM collects on its written index call options have significant influence on its return potential.

The Bloomberg U.S. Aggregate Bond Index returned -0.27% in January. The yield on the 10-year U.S. Treasury Note (the 10-year) began the year at 3.88% before climbing to an intra-month high of 4.18% on January 24. The yield on the 10-year closed the month slightly lower at 3.91%. In a historical inversion that has persisted since July 5, 2022, the yield on the 2-year U.S. Treasury Note exceeded that of the 10-year for the month.

1The BXMSM is a passive total return index designed to track the performance of a hypothetical buy-write strategy on the S&P 500® Index. The construction methodology of the index includes buying an equity portfolio replicating the holdings of the S&P 500® Index and selling a single one-month S&P 500® Index call option with a strike price approximately at-the-money each month on the Friday of the standard index-option expiration cycle and holding that position until the next expiration.

Sources: Morningstar DirectSM, Bloomberg, L.P. Performance data shown represents past performance and is no guarantee of, and not necessarily indicative of, future results.

For more information and access to additional insights from Gateway Investment Advisers, LLC, please visit www.gia.com.

Download: