The S&P 500® Index returned -5.17% for the month of January, marking the equity market’s worst month since March 2020 and the worst January since 2009. The 2021 year-end rally quickly transitioned to a new year freefall as concerns regarding plans to fight inflation with higher interest rates and tighter monetary policy combined with growing geopolitical tensions along the Ukraine border drove the equity market down in January. The S&P 500® Index entered correction territory on January 24 when the equity market was briefly more than 11% below its 2021 year-end closing level before it staged an impressive rally that afternoon. From close-to-close, the S&P 500® Index declined 9.73% from January 3 through January 27 before staging a 4.38% rally through month-end.
U.S. macroeconomic data released in January revealed a resilient macroeconmic environment and improving employment situation despite record inflation, supply chain issues and ongoing labor market disruptions. The first estimate of Gross Domestic Product for the fourth quarter of 2021 showed that the U.S. grew at an annualized rate of 6.9%, significantly exceeding the consensus expectation. The unemployment rate was also better than the consensus estimate as it declined from 4.2% in November to 3.9% in December while the participation rate held steady at 61.9%. The December Consumer Price Index, released January 12 was the highest reading since 1982, showed a year-over-year increase of 7.0% which was slightly below the consensus estimate. Fourth quarter aggregate operating earnings were on track to climb over 7% quarter-over-quarter while increasing nearly 67% year-over-year. With over 33% of companies reporting, more than 81% met or exceeded analyst estimates.
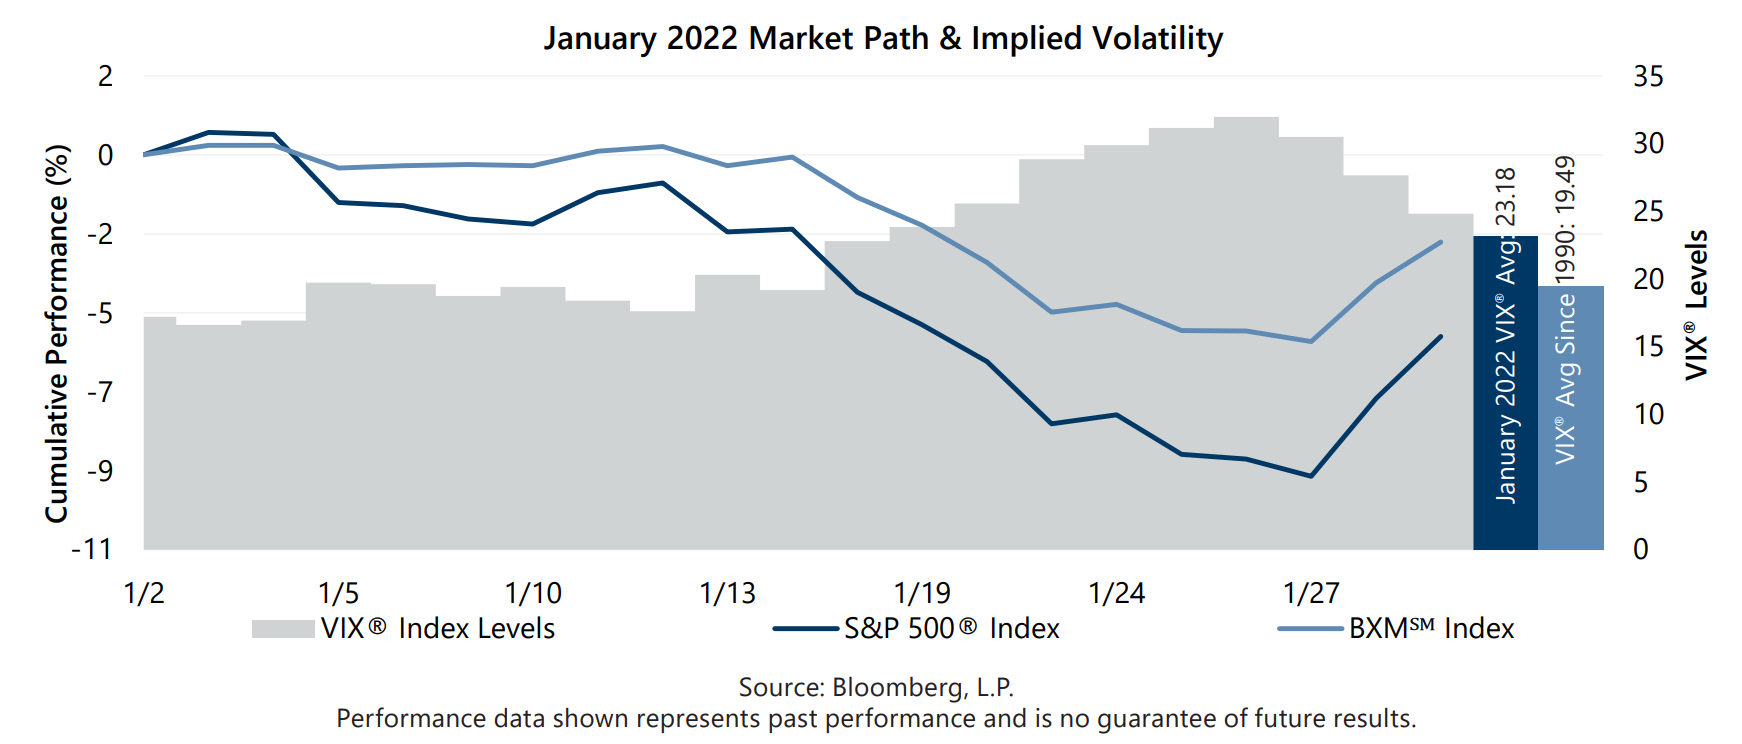
Implied volatility, as measured by the Cboe® Volatility Index (the VIX®), averaged 23.18 in January. Consistent with its typical relationship, average implied volatility exceeded realized volatility, as measured by the standard deviation of daily returns for the S&P 500® Index, which was 18.72% for the month. January’s 4.5 percentage point spread between S&P 500® Index realized volatility and average implied volatility, often referred to as the Volatility Risk Premium, continued the 16-month trend of readings that have been above the historical monthly average of 4.2%. The VIX® opened January at its intra-month low of 16.60. As the equity market decline intensified, the VIX® climbed to a monthly intra-day high of 38.94 on January 24. The VIX® reached a closing high for the month of 31.96 on January 26. The VIX® ended the month at 24.83.
The Cboe® S&P 500 BuyWriteSM Index1 (the BXMSM) returned -2.49% in January, outperforming the S&P 500® Index by 268 basis points (bps). The BXMSM provided 415 bps of downside risk mitigation during January’s tumultuous drawdown from January 3 through January 27 with a return of -5.58% relative to the -9.73% return of the S&P 500® Index. On the third Friday of each month, the BXMSM writes a new index call option as the option it wrote the previous month expires. The premiums the BXMSM collects on its written index call options have significant influence on its return potential during market advances and help to mitigate market declines. Remaining time premium from the call option written in December helped the BXMSM provide significant downside protection during the equity market’s maximum drawdown period. From the beginning of the month through January 20, the day prior to the expiration of its written call option, the BXMSM returned -3.07% while the S&P 500® Index returned -5.89%. On January 21, the BXMSM wrote a new index call option with a February expiration and collected a premium of 2.09%. Earning a portion of the premium it received helped the BXMSM nearly keep pace with the S&P 500® Index over the remainder of the month. The BXMSM returned 0.59% from its closing value on January 20 through month-end, relative to the 0.75% return of the S&P 500® Index over the same period.
The Bloomberg U.S. Aggregate Bond Index (the Agg) returned -2.15% in January. The Agg has posted negative returns in 12 of the last 24 months including six of eight months in which the S&P 500® Index return was negative. The yield on the 10-year U.S. Treasury Note started January at an intra-month low of 1.63% and rose to an intra-month high of 1.87% on January 18 before closing the month at 1.78%.