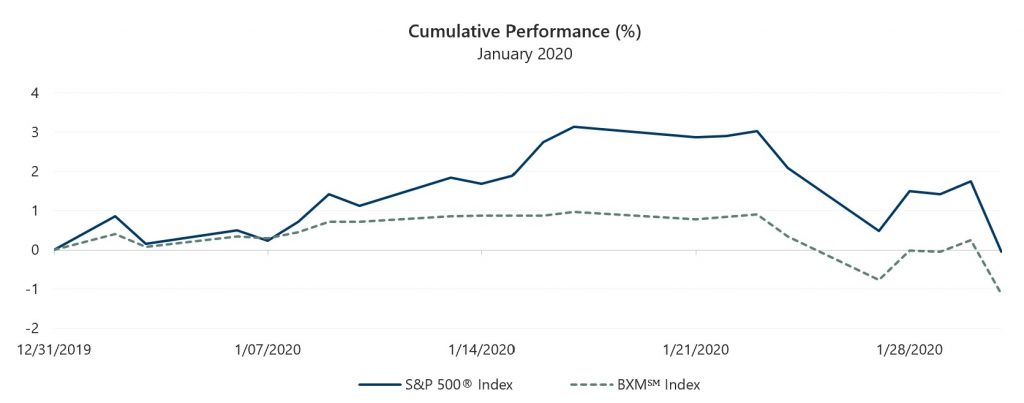
The S&P 500® Index declined 0.04% in January, with the small loss concealing significant intra-month volatility. January started strong with the S&P 500® Index returning 3.14% from the beginning of the year through January 17, supported by momentum from an impressive 2019 equity market rise and increasing clarity around global trade issues. However, fears that the spread of the coronavirus would have a negative impact on the global economy caused the S&P 500® Index to reverse course over the second half of the month. From January 17 through the end of the month, the S&P 500® Index returned -3.08%.
January data releases showed a stable economic environment, all but erasing concerns of a domestic slowdown. The first estimate of Gross Domestic Product growth for the fourth quarter of 2019 was 2.1%, aligned with consensus expectations and the growth rate of the third quarter. The unemployment rate held steady at 3.5% in December, in line with consensus expectations and supported by strong payroll data. The December Consumer Price Index, released on January 14, showed a 2.3% year-over-year increase, at the low end of consensus expectations. With nearly 17% of companies reporting, fourth quarter corporate earnings growth had been better than expected. Aggregate operating earnings were on track to grow 2.9% quarter-over-quarter and 3.9% year-over-year. Nearly 78% of companies that have reported earnings met or exceeded analyst estimates.
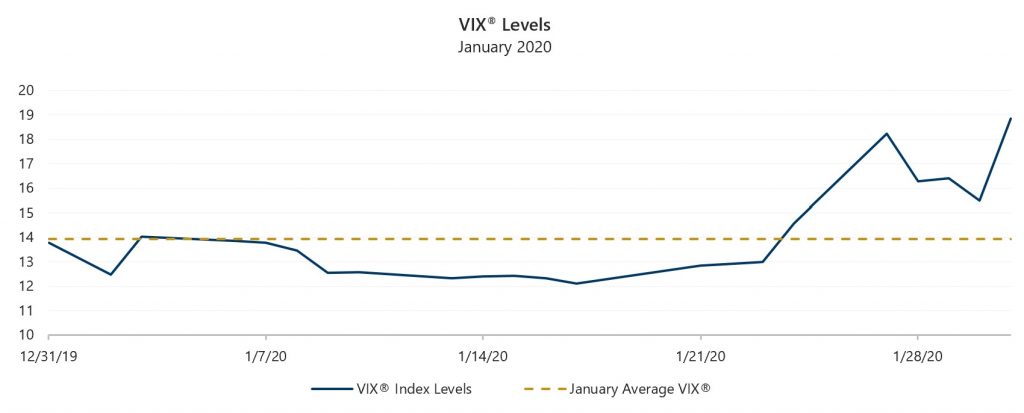
Implied volatility, as measured by the Cboe® Volatility Index (the VIX®), averaged 13.94 in January and exceeded realized volatility, which was 11.89% based on the standard deviation of daily returns for the S&P 500® Index. The VIX® opened the month at 12.47 before drifting to an intra-month low of 12.10 on January 17. The VIX® proceeded to climb and close the month at a January high of 18.84.
Source: Bloomberg, L.P.
The Cboe® S&P 500 BuyWriteSM Index1 (the BXMSM) returned -1.13% in January, underperforming the S&P 500® Index by 109 basis points (bps). On the third Friday of each month, the BXMSM writes a new index call option as the option it wrote the previous month expires. The premiums the BXMSM collects on its written index call options have significant influence on its return potential over a period when the market advances and helps to mitigate market declines. The premium the BXMSM collected in December helped it return 0.97% from the beginning of the year through January 17, but the premium was not enough to keep pace with the advance of the equity market as the BXMSM lagged the S&P 500® Index by 217 bps. On January 17, the BXMSM wrote a new index call option with a February expiration as its January option expired. The premium collected on the new index call option as a percentage of the BXM’sSM underlying value was 1.18% and it helped provide downside protection as the market declined over the remainder of the month. From January 17 to January 31, the BXMSM returned -2.08%, providing 100 bps of downside protection relative to the S&P 500® Index.
Source: Bloomberg, L.P.
Performance data shown represents past performance and is no guarantee of, and not necessarily indicative of, future results.
The Cboe® S&P 500 BuyWriteSM Index1 (the BXMSM) returned -1.13% in January, underperforming the S&P 500® Index by 109 basis points (bps). On the third Friday of each month, the BXMSM writes a new index call option as the option it wrote the previous month expires. The premiums the BXMSM collects on its written index call options have significant influence on its return potential over a period when the market advances and helps to mitigate market declines. The premium the BXMSM collected in December helped it return 0.97% from the beginning of the year through January 17, but the premium was not enough to keep pace with the advance of the equity market as the BXMSM lagged the S&P 500® Index by 217 bps. On January 17, the BXMSM wrote a new index call option with a February expiration as its January option expired. The premium collected on the new index call option as a percentage of the BXM’sSM underlying value was 1.18% and it helped provide downside protection as the market declined over the remainder of the month. From January 17 to January 31, the BXMSM returned -2.08%, providing 100 bps of downside protection relative to the S&P 500® Index.
1The BXMSM is a passive total return index designed to track the performance of a hypothetical buy-write strategy on the S&P 500® Index. The construction methodology of the index includes buying an equity portfolio replicating the holdings of the S&P 500® Index and selling a single one-month S&P 500® Index call option with a strike price approximately at-the-money each month on the Friday of the standard index-option expiration cycle and holding that position until the next expiration.