Implied volatility, as measured by the Cboe® Volatility Index (the VIX®), averaged 20.06 in February. Consistent with its typical relationship, average implied volatility exceeded realized volatility, as measured by the standard deviation of daily returns for the S&P 500® Index, which was 15.47% for the month. The VIX® ended January at 19.40 and quickly reached an intra-month low of 17.87 on February 1 before climbing to an intra-month high of 22.87 on February 21. The VIX® ended February at 20.70.
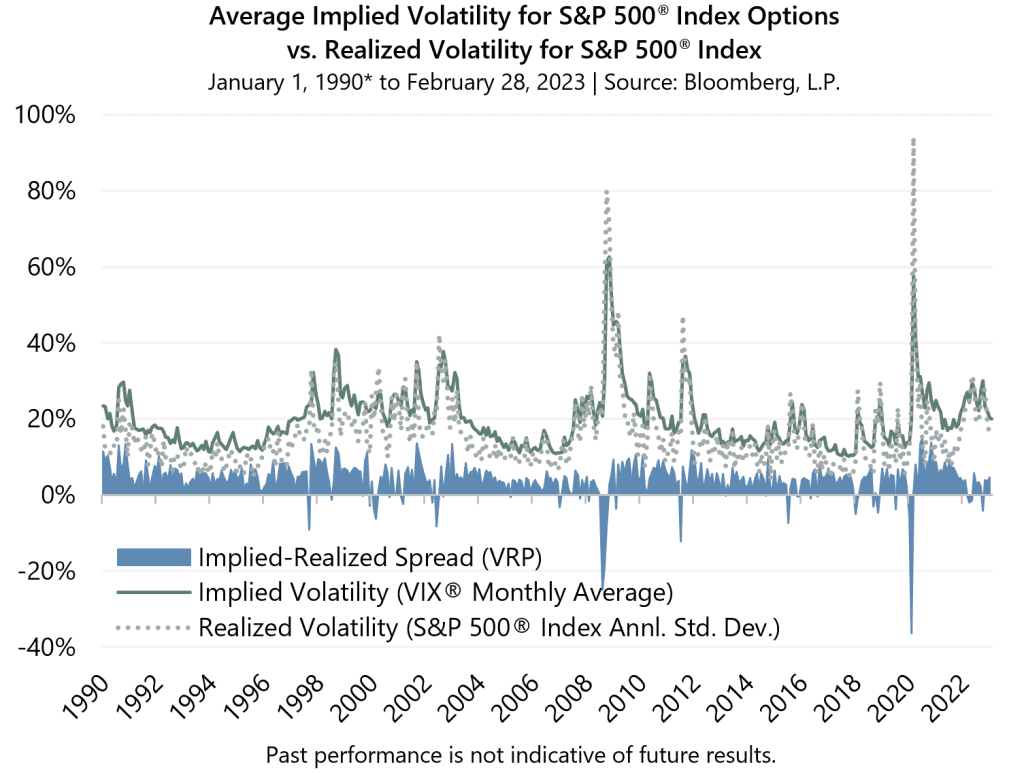
The Volatility Risk Premium (VRP) is the difference between the average closing price of the VIX®, or implied volatility, and the realized volatility for the S&P 500® Index. February’s 4.59 percentage-point spread between the two statistics was above the historical average of 4.07 and was the second highest reading in the last year. While both implied and realized volatility were elevated in 2022, the narrowing of the VRP over the prior twelve months was driven by significantly elevated realized volatility as equity markets entered bear market territory and faced several headwinds. Investors witnessed realized volatility levels that had not been seen since the onset of the pandemic in 2020.
VRP is frequently positive and often above its long-term average. Since the inception of the VIX® in January 1990, the VRP has been positive in nearly 90% of months and above the long-term average more than half of the time. Strategies that sell (write) index options can provide a potential source of improved risk-adjusted return by monetizing overpriced implied volatility.
Past performance is not indicative of future results. Data source: Bloomberg, L.P. *VIX® chart is based on published VIX® data which began on January 1, 1990. High and low measures are based on intra-day values; averages are based on daily closing values.