The S&P 500® Index returned -2.44% in February, bringing its year-to-date return to 3.69%. Investor euphoria in January, driven by persistently high inflation that appeared to soften and a less-hawkish tone from the Federal Reserve, was dampened in February. A resilient macroeconomic environment paired with higher-than-expected inflation revived concerns around the potential pace of monetary tightening. From the intra-month high on February 2 through month-end, the S&P 500® Index returned -4.85%. Through month-end, the S&P 500® Index has climbed 11.74% from its 2022 low set on October 12, yet remains 13.71% below its 2022 high set on January 3, 2022.
Despite ongoing tightening of monetary policy and concerns about its future pace, data released in February showed a steady U.S. economy, a persistently tight labor market and a slightly slower pace of inflation, albeit above estimates. The second estimate of Gross Domestic Product for the fourth quarter of 2022 showed that the U.S. continued to grow by an annualized rate of 2.7%, slightly below the consensus expectation of 2.9%. The December unemployment rate of 3.4% was a decline from the prior month and better than the consensus estimate, while the participation rate ticked up to 62.4%. The January Consumer Price Index, released February 14, showed a year-over-year increase of 6.4% – lower than the prior month but above the consensus expectation of 6.2%. Fourth quarter aggregate operating earnings were on track to decline 3.6% quarter-over-quarter while decreasing more than 5.8% year-over-year. With over 95% of S&P 500® Index companies reporting, 73% met or exceeded analyst estimates.
Implied volatility, as measured by the Cboe® Volatility Index (the VIX®), averaged 20.06 in February. Consistent with its typical relationship, average implied volatility exceeded realized volatility, as measured by the standard deviation of daily returns for the S&P 500® Index, which was 15.47% for the month. The 4.59 percentage-point spread between realized volatility and average implied volatility is above the historical average spread between the two statistics. The VIX® ended January at 19.40 and quickly reached an intra-month low of 17.87 on February 1 before climbing to an intra-month high of 22.87 on February 21. The VIX® ended February at 20.70.
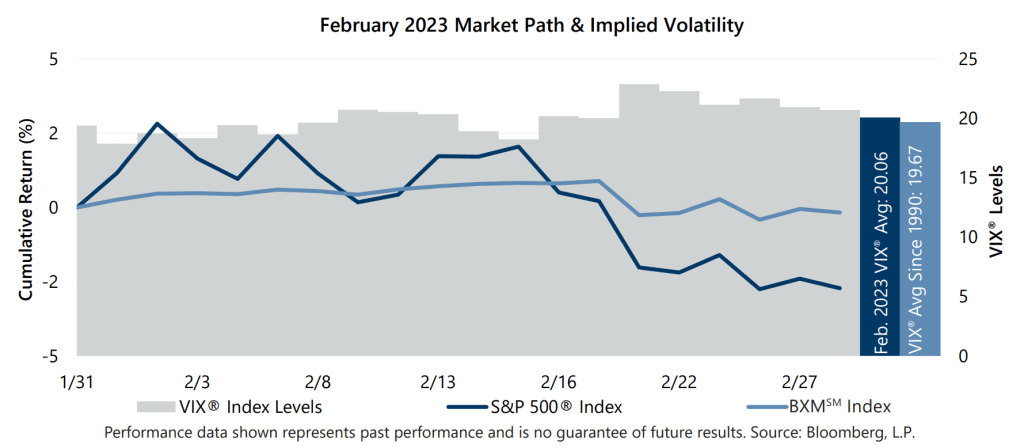
The Cboe® S&P 500 BuyWriteSM Index1 (the BXMSM) returned -0.16% in February, outperforming the S&P 500® Index by 228 basis points (bps). The BXMSM provided 428 bps of downside risk mitigation during February’s drawdown from February 2 through month-end with a return of -0.57% relative to the -4.85% return of the S&P 500® Index. On the third Friday of each month, the BXMSM writes a new index call option as the option it wrote the previous month expires. The premiums the BXMSM collects on its written index call options have significant influence on its return potential during market advances and help to mitigate market declines. The BXMSM began the month with an in-the-money written index call option due to the market advance during January, leading to relatively low market exposure during the first two weeks of February. Reduced market exposure paired with the remaining time premium to earn from its in-the-money index call option combined to help the BXMSM outpace the S&P 500® Index from the beginning of the month through February 16, the day prior to the expiration of its written call option. The BXMSM returned 0.73% through February 16, while the S&P 500® Index returned 0.46% over the same period. On February 17, the BXMSM wrote a new index call option with a March expiration and collected a premium of 2.08%. Earning a portion of the premium it received contributed to the return of the BXMSM over the remainder of the month. The BXMSM provided 201 bps of downside loss mitigation with a return -0.88% from its closing value on February 16 through month-end, while the S&P 500® Index returned -2.89% over the same period.
The Bloomberg U.S. Aggregate Bond Index (the Agg) returned -2.59% in February as it continued to face a strong rising-rate headwind. With February’s loss, the Agg has now declined in 13 of the previous 14 months in which the S&P 500® Index declined. The yield on the 10-year U.S. Treasury Note (the 10-year) ended January at 3.51% before dropping to its intra-month low of 3.39% on February 2. The yield on the 10-year then climbed significantly to its intra-month high of 3.95% on February 21, before ending the month at 3.92%. Throughout February the yield on the 2-year U.S. Treasury Note exceeded that of the 10-year, an inversion of its typical relationship that began on July 5, 2022.
1The BXMSM is a passive total return index designed to track the performance of a hypothetical buy-write strategy on the S&P 500® Index. The construction methodology of the index includes buying an equity portfolio replicating the holdings of the S&P 500® Index and selling a single one-month S&P 500® Index call option with a strike price approximately at-the-money each month on the Friday of the standard index-option expiration cycle and holding that position until the next expiration.
Sources: Morningstar DirectSM, Bloomberg, L.P. Performance data shown represents past performance and is no guarantee of, and not necessarily indicative of, future results.
For more information and access to additional insights from Gateway Investment Advisers, LLC, please visit www.gia.com.