The S&P 500® Index returned -2.99% for the month of February, its second monthly decline in a row, bringing its year-to-date return to -8.01%. The headwinds the equity market has faced in the new year intensified in February. Geopolitical tensions escalated into a full-scale Russian invasion of Ukraine as investors continued to digest high inflation, the expectation for rising interest rates and tightening monetary policy. The S&P 500® Index declined 11.73% from January 3 through February 23, establishing a new year-to-date low.
U.S. macroeconomic data released in February revealed an ongoing resiliency in the macroeconomic environment despite persistent headwinds. The second estimate of Gross Domestic Product for the fourth quarter of 2021 showed that the U.S. grew at an annualized rate of 7.0%, in line with the consensus expectation. The unemployment rate was slightly higher than the consensus estimate, climbing from 3.9% in December to 4.0% in January while the participation rate climbed to 62.2%. The January Consumer Price Index, released February 10, continued to defy gravity with a year-over-year increase of 7.5% which was above the consensus expectation. Fourth quarter aggregate operating earnings were on track to climb over 8% quarter-over-quarter while increasing more than 67% year-over-year. With nearly 95% of companies reporting, more than 79% met or exceeded analyst estimates.
Implied volatility, as measured by the Cboe® Volatility Index (the VIX®), averaged 25.75 in February. Consistent with its typical relationship, average implied volatility exceeded realized volatility, as measured by the standard deviation of daily returns for the S&P 500® Index, which was 22.56% for the month. February’s 3.2 percentage point spread between S&P 500® Index realized volatility and average implied volatility, often referred to as the Volatility Risk Premium, was below its historical monthly average of 4.1% for the first time in 16 months. The VIX® opened February at 21.96 and reached an intra-month low of 19.96 on February 9. As the equity market decline intensified and Russia invaded Ukraine, the VIX® climbed to an intra-month high of 31.02 on February 23. The VIX® ended the month at 30.15.
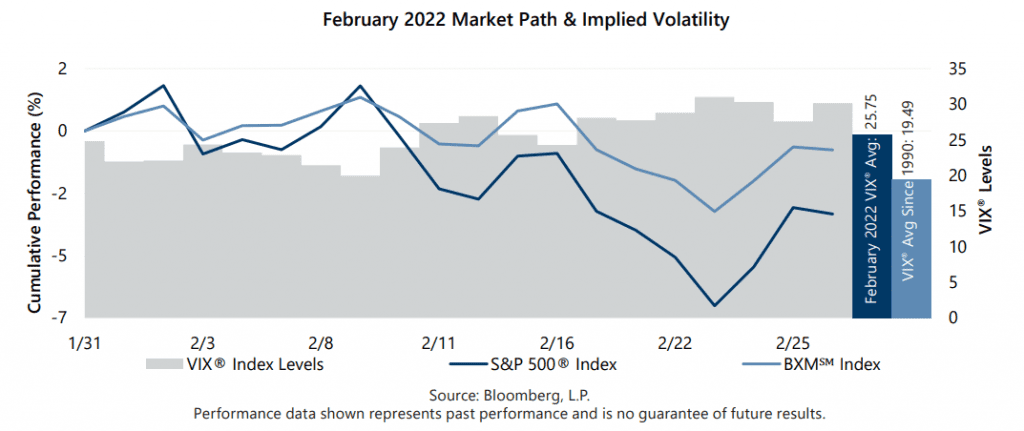
The Cboe® S&P 500 BuyWriteSM Index1 (the BXMSM) returned -0.68% in February, outperforming the S&P 500® Index by 231 basis points (bps). The BXMSM provided 404 bps of downside risk mitigation during February’s drawdown from February 2 through February 23 with a return of -3.78% relative to the -7.82% return of the S&P 500® Index. On the third Friday of each month, the BXMSM writes a new index call option as the option it wrote the previous month expires. The premiums the BXMSM collects on its written index call options have significant influence on its return potential during market advances and help to mitigate market declines. Remaining time premium from the call option written in January helped the BXMSM provide significant downside protection during the equity market’s drawdown period. From the beginning of the month through February 17, the day prior to the expiration of its written call option, the BXMSM returned -0.68% while the S&P 500® Index returned -2.90%. On February 18, the BXMSM wrote a new index call option with a February expiration and collected a premium of 2.40%. Earning a portion of the premium it received helped the BXMSM provide downside risk mitigation relative to the S&P 500® Index over the remainder of the month. The BXMSM returned -0.01% from its closing value on February 17 through month-end, relative to the -0.10% return of the S&P 500® Index over the same period.
The Bloomberg U.S. Aggregate Bond Index (the Agg) returned -1.12% in February. The Agg has posted negative returns in 13 of the last 24 months including seven of eight months in which the S&P 500® Index return was negative. The yield on the 10-year U.S. Treasury Note started February at 1.79%, reached an intra-month low of 1.78% on February 2, then climbed to an intra-month high of 2.04% on February 15. The yield on the 10-year closed the month at 1.83%.
1The BXMSM is a passive total return index designed to track the performance of a hypothetical buy-write strategy on the S&P 500® Index. The construction methodology of the index includes buying an equity portfolio replicating the holdings of the S&P 500® Index and selling a single one-month S&P 500® Index call option with a strike price approximately at-the-money each month on the Friday of the standard index-option expiration cycle and holding that position until the next expiration.
Sources: Morningstar DirectSM, Bloomberg, L.P. Performance data shown represents past performance and is no guarantee of, and not necessarily indicative of, future results.
For more information and access to additional insights from Gateway Investment Advisers, LLC, please visit www.gia.com.