Despite new all-time highs for the S&P 500® Index in January, the Cboe® Volatility Index (the VIX®) remained above 20 throughout the month and extended its streak of consecutive business days above 20 to 237. The last time the VIX® posted a daily closing value below 20 was February 21, 2020. As the chart below shows, it is not uncommon for the VIX® to remain elevated after extreme volatility spikes, but the current streak stands out relative to other post-spike time periods.
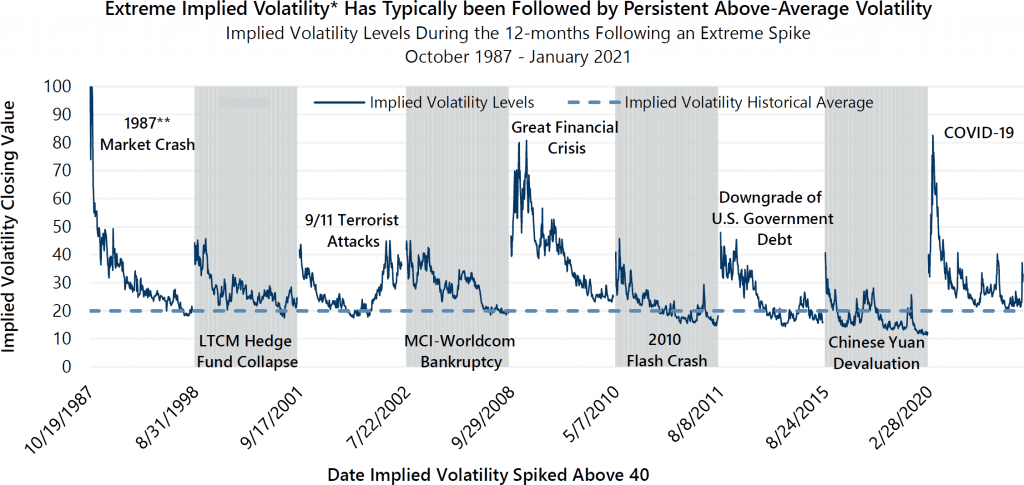
*Implied volatility levels displayed are a combination of the Cboe® S&P 100 Volatility Index® (the VXO®) and the VIX®. Daily pricing for the VIX® is available from January 2, 1990 to present. The VXO® prices are used for dates prior to 1990. **Graph is truncated for readability. The VXO® was priced at 150.19 on Black Monday, October 19, 1987. Source: Bloomberg, L.P.
The current run of the VIX® remaining above 20 will become the second-longest streak in history if it surpasses the 239-day mark, set from July 1998 to June 1999, a period that included the volatility spike caused by the collapse of the hedge fund Long-Term Capital Management L.P. The Great Financial Crisis and its aftermath produced the longest-ever streak as the VIX® closed above 20 for 331 consecutive business days from August 2008 to December 2009.
January 2021’s highest implied volatility readings came during the last week of the month as the market processed remarks from the Federal Reserve’s newly appointed Treasury Secretary, Janet Yellen, and congressional leaders on the state of the economy and prospects for additional fiscal policy response to the pandemic. At the same time, a handful of companies with high levels of short interest, including GameStop Corp., were gaining attention as retail investors drove high volumes of trading in their shares and options.
Our December Market Perspective, Will Volatility Risk Premium Remain Attractive in 2021?, noted that ongoing concerns about the pandemic and the growth of option trading among retail investors were among the factors that may continue to keep implied volatility elevated in 2021. These factors not only influenced the daily closing prices of the VIX® in January, but they contributed to an upward shift in implied volatility pricing across the VIX® futures curve over the course of the month. At the end of January, VIX® futures pricing for contracts expiring in February through July reflected expectations of VIX® levels of 30 or higher, whereas the same contracts were all priced in the mid-20s at the end of December.
Upward trending equity markets combined with above-average implied volatility levels is a beneficial combination of market conditions for investment strategies that generate cash flow from index option writing. How long this set of conditions persists remains to be seen. As always, Gateway will look for opportunities to take advantage of the current environment while vigilantly preparing to take appropriate action should conditions change.
*For more information and access to additional insights from Gateway Investment Advisers, LLC, please visit www.gia.com/insights.