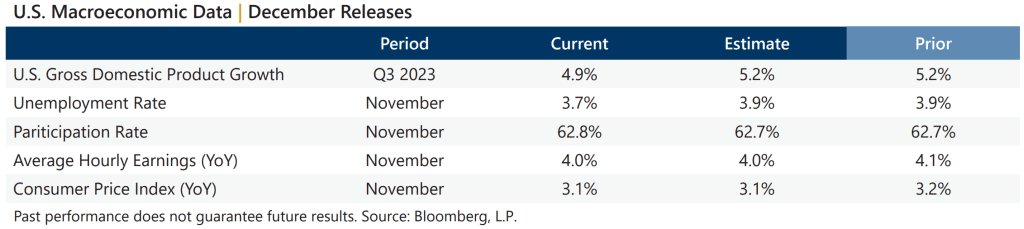
Data released during December continued to reflect a strong economy and resilient labor market. The final estimate of Gross Domestic Product for the third quarter of 2023 showed that the U.S. grew by an annualized rate of 4.9%, missing expectations and revised downward from the prior estimate. The December unemployment rate of 3.7% was an improvement over November data and better than the consensus estimate, both of which were 3.9%. The participation rate ticked up to 62.8%. The November Consumer Price Index, released December 12, showed a year-over-year increase of 3.1%, which matched expectations. On the corporate earnings front, third-quarter aggregate operating earnings were on track to climb less than 1% quarter-over-quarter and just over 3% year-over-year. With more than 99% of S&P 500® Index companies reporting, over 83% met or exceeded analyst estimates.
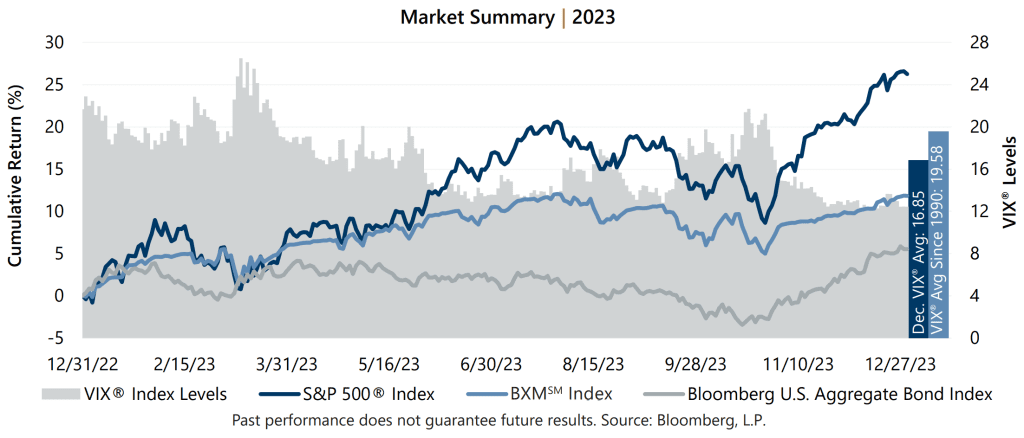
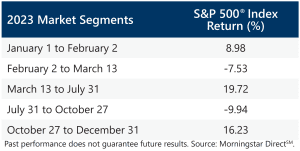 The S&P 500® Index returned 7.50%, 8.74%, -3.27%, and 11.69% in the first, second, third, and fourth quarters of 2023, respectively. Despite significant turmoil and conflict across the globe, the year was all about the Fed and expectations surrounding monetary policy. Investors deconstructed economic results and forecasts in an effort to predict the direction of policy and, most importantly, the level and pace of interest rate increases. After record inflation and negative equity markets in 2022, signs of softening inflation in January 2023 generated a feeling of hope from investors before reality realigned expectations. Several regional banks facing pressure from sudden and significant rate increases collapsed or required rescue. As confidence in the financial system showed signs of deterioration, the Fed enacted emergency measures which helped drive a significant rally in the S&P 500® Index. Last-minute negotiations around the U.S. debt ceiling helped trigger a surprise U.S. credit downgrade by Fitch Ratings and a second wave of regional bank downgrades. The sudden uncertainty contributed to a significant equity market decline from the end of July through October 27 before the market advanced through year-end as a feeling of hope for the new year sprouted, once again.
As typical with the equity market advancing significantly during 2023, implied volatility drifted lower. Implied volatility, as measured by the Cboe® Volatility Index (the VIX®), ended 2022 at 21.67 and averaged 16.85 during 2023. Consistent with its typical relationship, average implied volatility exceeded realized volatility, as measured by the standard deviation of daily returns for the S&P 500® Index, which was 13.10% for the year. The Volatility Risk Premium, or the difference between the two volatility measures, was positive throughout the year and averaged 4.19% in 2023, above the since-1990 average of 4.08%.
The VIX® spent most of 2023 ranging from the mid-teens to the mid-20s, closing above its long-term average of 19.58 for more than 20% of the year. The VIX® reached an intra-year high of 26.52 on March 13 at the height of the banking crisis before settling into a quiet summer supported by an outstanding equity market rally and optimism surrounding the path of interest rates. The selloff from July 31 through October 27 drove the measure higher, reaching a fourth quarter high of 21.71 on October 20. Implied volatility during the end of 2023 was stifled as hopes grew for an extended pause, or even cut, in interest rates. The VIX® reached an intra-year low of 12.07 on December 12 and ended 2023 at 12.45.