The S&P 500® Index returned 9.07% for the fourth quarter of 2019, resulting in a return of 31.49% for the year. The fourth quarter advance was steady with the S&P 500® Index posting returns of 2.17%, 3.63% and 3.02% in October, November and December, respectively.
Fourth quarter returns were buoyed by increasing clarity around U.S. trade negotiations. Specifically, ‘phase one’ negotiations between the U.S. and China were finalized and set to be signed in early 2020. Additionally, the United States-Mexico-Canada Agreement advanced to the Senate for ratification after Democrats in the House of Representatives agreed to modifications negotiated with the Trump Administration and a decisive U.K. election brought the Brexit process closer to an end. The domestic economic environment showed strength on many fronts. On December 20, the final read of Q3 GDP growth came in at 2.1%, at the top of consensus estimates. The unemployment rate settled the quarter at 3.5%, a 50-year low, after nonfarm payrolls crushed expectations. A tight employment situation and a confident consumer led the year-over-year change for the November Consumer Price Index to 2.1%, at the top of expectations and in line with the Federal Reserves (the Fed) 2% target. On the corporate front, third quarter earnings declined less than 1% quarter-over-quarter and grew nearly 2% year-over-year. Though earnings shrank in aggregate for the quarter, results were better than expected with nearly 82% of reporting companies meeting or exceeding analyst estimates.
The fourth quarter market advance, combined with a first quarter return of 13.65%, drove the S&P 500® Index to its best annual return since 2013 and an annual return of over 30% for just the fifth time in the last three decades. The strong first quarter return followed steep losses in the fourth quarter of 2018 that were primarily driven by concerns of overly tight monetary conditions in the face of slowing global economic growth. After four rate hikes in 2018 and expectations of more in 2019, the first quarter recovery was fueled by the Fed rhetoric indicating a potential policy shift. The year began with talk of fewer-than-expected rate hikes in 2019 plus a slower reduction in the size of the Fed’s balance sheet. Fed policy ultimately evolved into three rate cuts and a resumption of balance sheet growth in the second half of the year.
Between the first and fourth quarters of 2019, the equity market advance was choppy and moderate as the market processed uncertainty over Fed policy, trade and the global economy. Though the S&P 500® Index returned 6.08% over the course of the second and third quarters, it experienced two sizeable drawdowns of 6.62% and 5.99%, occurring from May 3 through June 3 and July 26 through August 14, respectively. The first drawdown was driven by unease over trade and global economic growth as tensions between the U.S., China and Mexico escalated in concert with slowing growth in China. The equity market was particularly volatile during the second drawdown as the S&P 500® Index had three separate one-day declines of over 2.50% in August. The last time a month included three one-day declines of that magnitude was September 2011 when the equity market was reeling from the credit rating downgrade of U.S. government debt. Despite these mid-year pullbacks and persistent concern over U.S. monetary policy, global trade, and economic growth, implied volatility levels were persistently below their historical average in 2019.
The Cboe® Volatility Index® (the VIX®) averaged 13.99 for the fourth quarter of 2019 and 15.39 for the full year, both below its historical average of 19.15. The 2019 closing high for the VIX® was 25.45 on January 3, as equity markets recovered from nearly-bear market territory in December 2018. The 2019 low for the VIX® was 11.54 on November 26, amidst strong returns in the equity market, before it closed the year at 13.78. Consistent with its typical relationship, average implied volatility exceeded realized volatility, as measured by the annualized standard deviation of daily returns for the S&P 500® Index, which was 12.47% for the year. The implied versus realized volatility relationship was consistent throughout 2019 with average implied volatility exceeding realized volatility in 11 months. The singular exception was August, when realized volatility averaged 22.70% while the implied volatility response to the market’s large drawdown and sharp daily losses was muted, resulting in a VIX® average of just 18.98 for the month.
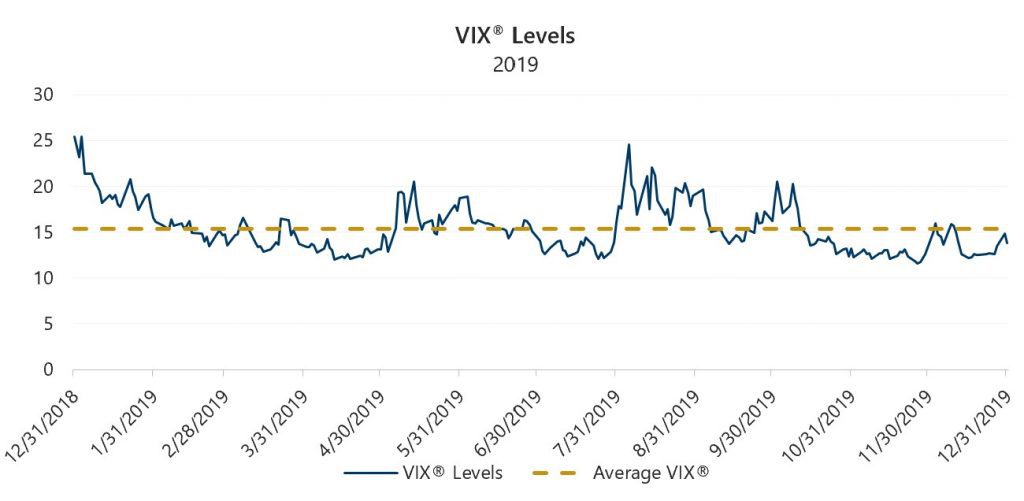
Source: Bloomberg, L.P.
The Cboe® S&P 500 BuyWriteSM Index (the BXMSM) had a return of 4.33% for the fourth quarter, underperforming the S&P 500® Index by 474 basis points (bps) and bringing its return to 15.68% for 2019. On the third Friday of each month, the BXMSM wrote a new index call option as the option it wrote the previous month expired. The premiums the BXMSM collects on written options have significant influence on its return potential over a period when the market advances and help to mitigate losses during market declines. Premiums collected as a percentage of the BXM’sSM underlying value were 1.17%, 1.26% and 1.02% in October, November and December, respectively. With monthly returns of 2.06%, 1.29% and 0.92%, the BXMSM underperformed the S&P 500® Index in each month of the quarter, with the largest differentials occurring in November and December as the equity markets advanced at a well-above-average rate. Premiums collected by the BXMSM were consistent with the low and downward trending volatility levels present in the fourth quarter. During the second and third quarter equity market drawdowns, the premiums collected by the BXMSM provided downside protection relative to the S&P 500® Index during each drawdown period. The BXMSM declined 3.57% and 4.57%, compared to the S&P 500® Index decline of 6.62% and 5.99%, during the May 3 through June 3 and July 26 through August 14 drawdowns, respectively.
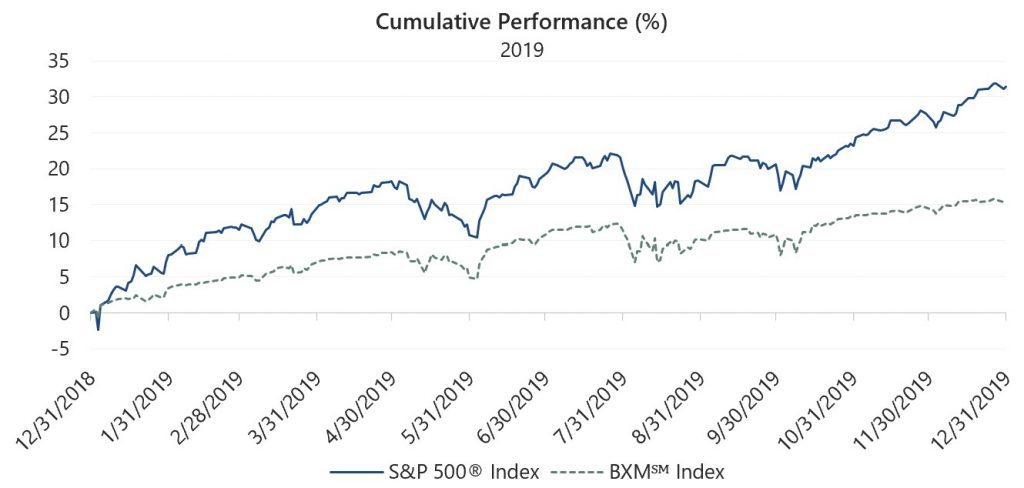
Source: Bloomberg, L.P.
Performance data shown represents past performance and is no guarantee of, and not necessarily indicative of, future results.
The Bloomberg Barclays U.S. Aggregate Bond Index returned 0.18% for the fourth quarter of 2019, resulting in a return of 8.72% for the year. The yield on the 10-year U.S. Treasury Note (the 10-year) ended the third quarter at 1.66% and rose to a fourth quarter high of 1.94% on November 8 before falling to end the year at 1.92%. Over 2019, the yield on the 10-year generally declined as the Fed shifted back into accommodative monetary policy after an attempt to normalize in 2018. During the tumultuous month of August, the spread between the 2- and 10-year U.S. Treasury Notes reflected an inverted yield curve with the 2-year yield exceeding the 10-year yield by 5 bps. As equity market volatility subsided, the spread between the 2- and 10-year turned positive and widened to an intra-year high of 35 bps on December 31.
Sources: Morningstar DirectSM, Bloomberg, L.P. Performance data shown represents past performance and is no guarantee of, and not necessarily indicative of, future results.
1The BXMSM is a passive total return index designed to track the performance of a hypothetical buy-write strategy on the S&P 500® Index. The construction methodology of the index includes buying an equity portfolio replicating the holdings of the S&P 500® Index and selling a single one-month S&P 500® Index call option with a strike price approximately at-the-money each month on the Friday of the standard index-option expiration cycle and holding that position until the next expiration.