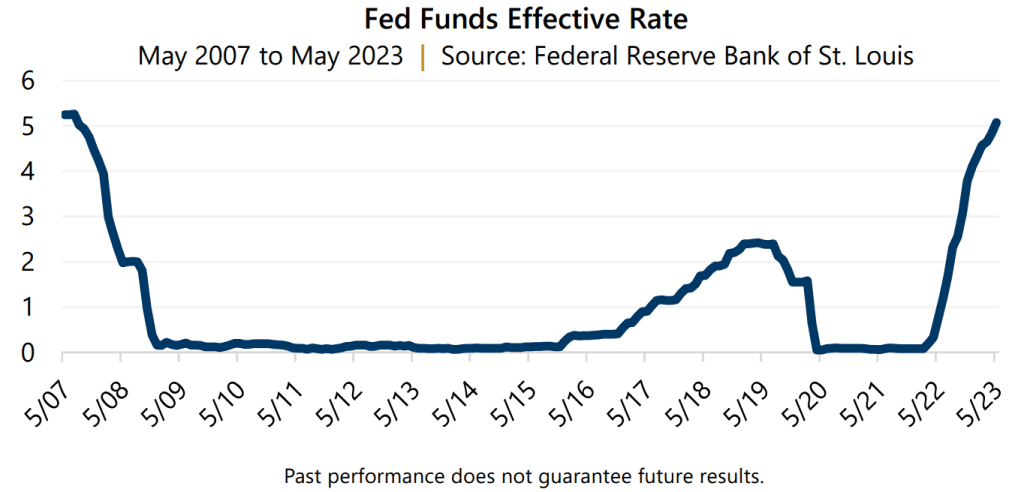
There has been much handwringing about the U.S. Federal Reserve’s (the Fed) persistent efforts to tame inflation and tighten monetary policy by increasing interest rates. The Fed Funds Effective Rate climbed more than 660% from May 2022 through May 2023, increasing from 0.77% to 5.08%, which is a level not seen since July 2007. A move of such magnitude, in such a short time, understandably has potential to disrupt a macroeconomic environment grown accustomed to low rates and accommodative monetary policy. Recently, signs of disruption have emerged in numerous regional bank failures.
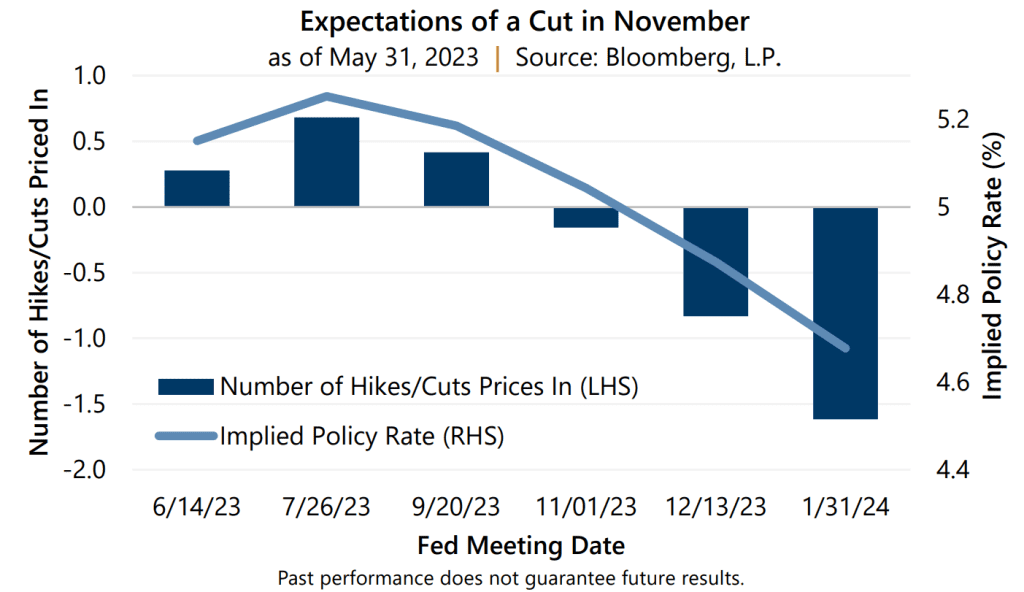
Historically, investors might view a banking crisis as a warning sign, but investors today may instead be feeling relief – and hopeful that this turmoil provides the Fed a signal that it has gone far enough in its tightening efforts. In fact, with inflation easing slightly and indications that the banking crisis may not fully be in the rearview mirror, many investors are anticipating the end of the current interest rate hiking cycle. At the end of May there was an expectation, with a 57% probability, that the Fed would not only pause their rate of interest rates hikes but cut rates by November 2023.
Some market participants may view such a reversal in policy as a potentially bullish development. The historical record is not so sanguine as the effects of monetary policy tend to lag policy action and have the potential to be followed by significant drawdowns. The following table details six instances in which the Fed cut interest rates since 1990.
On average, the equity market advanced 5.13% in the 12 months after the Fed cut. However, investors had to withstand significant drawdowns and increased volatility along the way. During the 12 months after an interest rate cut, the S&P 500® Index experienced an average maximum drawdown of -19.49%. Implied volatility, as measured by the Cboe® Volatility Index (the VIX®), averaged 22.81 during this period and posted an average maximum closing level of 44.26. The VIX® long-term average was 19.67 at the end of May.
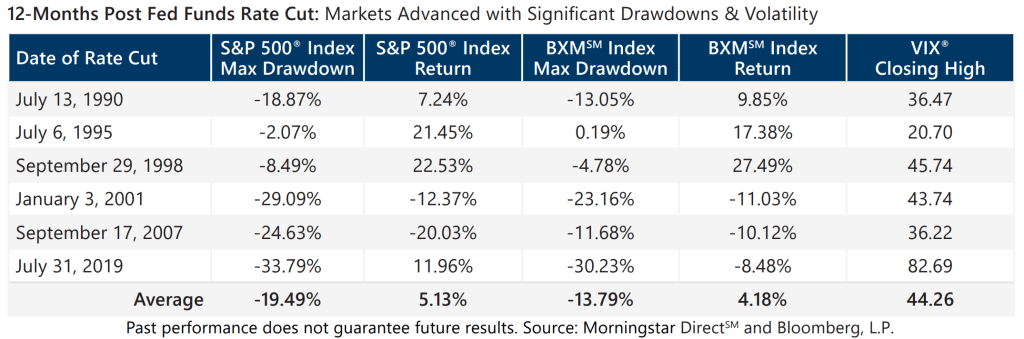
While the path forward from shifting monetary policy may be bumpy, specifically after a reduction in the Fed Funds Rate, option writing strategies that benefit from higher volatility and generate risk reducing cash flow, can help investors stomach turbulence. On average, during the 12 months after an interest rate cut, the Cboe® S&P 500 BuyWriteSM Index (BXMSM Index) advanced by 4.18% while experiencing an average maximum drawdown of 13.79%. If current levels of volatility and interest rates persist, or move higher, option writing premiums may continue to be an effective source of risk-reduced return potential as well as downside protection. Whether the Fed proceeds with further hikes, pauses, or even cuts rates, investment strategies that combine equity market exposure with cash flow from writing index options, like those managed by Gateway, may benefit from relatively higher levels of interest rates and implied volatility. Elevated cash flow provides strong return potential during market advances and attractive downside protection potential in down markets.
Gateway avoids making market predictions but drivers of volatility, including the Fed and its future path of monetary policy, appear to be not-short-term in nature. For those concerned that Fed policy may cause the U.S. economy or capital market conditions to deteriorate further, managing risk with strategies that generate cash flow from option writing may prove fruitful. For investors who feel that the Fed may be seeing its battle with inflation as nearing an end and expect conditions to improve, index option-based low volatility equity strategies offer the potential to participate in a market advance while managing risks associated with equity investments. Since 1977, Gateway has provided access to the unique potential of option strategies, helping investors navigate an array of equity and bond market environments.
Past performance is no guarantee of future results.
For more information and access to additional insights from Gateway Investment Advisers, LLC, please visit www.gia.com/insights.