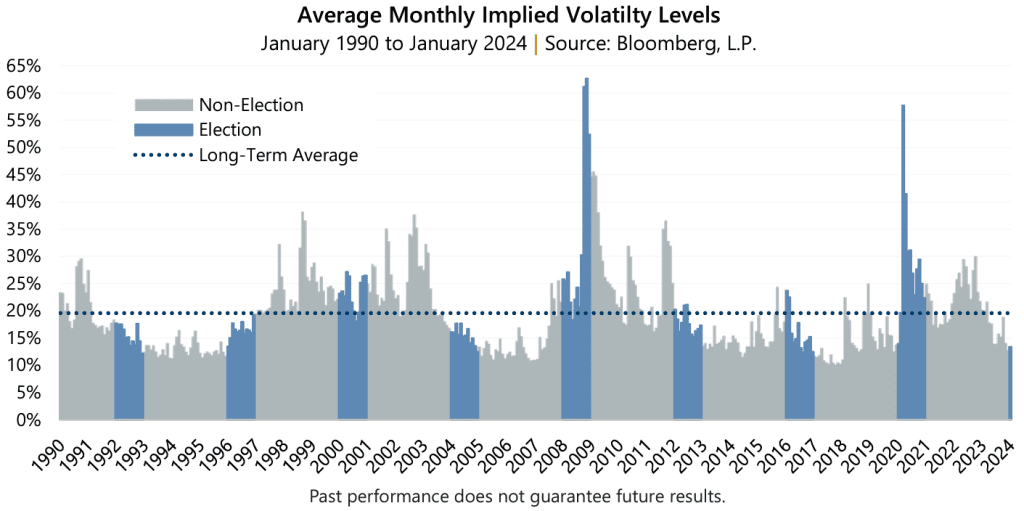
Buckle Up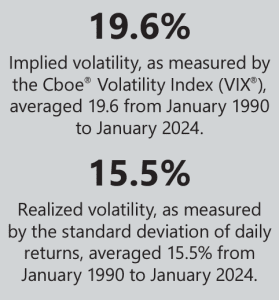 A U.S. presidential election year has arrived, and investors might be bracing themselves for the onslaught of campaign commercials and political distractions. Add to the mix an observation that historically, on average, election years have been more volatile than non-election years. Looking from January 1990 to January 2024, implied volatility averaged 20.7% and realized volatility averaged 17.5% during election years. Compare this to non-election years in which implied volatility averaged 19.2% and realized volatility averaged 14.9%.
A closer look shows that investors may do well to avoid the distraction of election season and, instead, focus on staying vigilant to the unexpected. Since 1990, there have been a total of eight U.S. presidential elections. Of these years, it turns out that just three had average implied volatility levels above the since-1990 average of 19.6%. Those three years were 2000, 2008, and 2020. Many investors may recall that, during those three years major global events other than presidential elections occurred that potentially had a pronounced impact on volatility. Thus, a case could possibly be made that other macro factors may influence volatility more than the U.S. presidential election.
Moreover, the outsize impact of these three years on “election year volatility” can be shown by calculating the median of implied and realized volatility for both election and non-election years. The median formula helps filter out extremes that get captured with a simple average. Interestingly, since 1990, median volatility levels are actually lower in election years compared to non-election years. Median implied volatility for election years is 17.7% compared to 17.8% for non-election years, and median realized volatility is 12.6% for election years versus 13.3% for non-election years. As it may be, investors should be leery of lowering their guard.
Elections may have the potential to contribute to increased volatility, although they are a known unknown. It is the true unknowns that seem to matter most. Macroeconomic and market events appear to be the major driver of volatility in election years just as in non-election years. We look at 2000, 2008, and 2020 in more detail below.
2000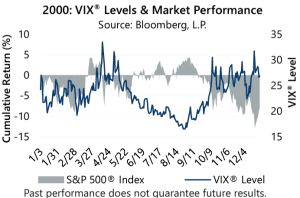 It was the wild west of the internet, the “Dot-Com” bubble had burst, and the U.S. Federal Reserve (the Fed) had raised interest rates from the third quarter of 1999 until eventually pausing during the third quarter of 2000. Keeping an eye on risk was suddenly smart and for good reason. Volatility spiked in the spring of 2000 and spiked again in the fourth quarter as concerns about a recession and its impact on corporate earnings began to weigh on investors and led the market lower. This occurred just after the market had rallied to an at-the-time all-time high in March 2000, which may have made the equity market more vulnerable to the negative surprises. The detail reveals, however, that implied volatility peaked well before November 2000 and election day marked no catalyst in volatility, one way or the other.
2008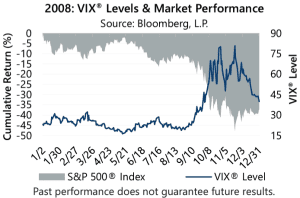 Yikes. The stock market had come off all-time highs in late 2007 with relatively tolerable declines until the month prior to the election, when things really heated up. The Fed had started to lower interest rates toward the end of 2007 after years of tightening and worries about the health of the housing and financial system started to intensify. By the fourth quarter, the Great Financial Crisis was well underway. Early-2008 showed small spikes in volatility as worries of a recession emerged and intensified with the failure of Bear Stearns in March. Later in 2008, however, the failure of Lehman Brothers fueled fears of a massive global financial contagion event with investor fear manifesting itself with volatility levels soaring to heights not seen since before 1990. Again, while the election did exist alongside volatility, investors were proven smart if focusing elsewhere in 2008.
2020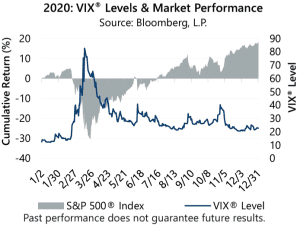 A year to forget. Entering 2020 there were percolating concerns about the potential for a slowing economy from interest rate hikes and issues in overnight lending markets, both of which emerged late in 2019. However, the COVID-19 pandemic and “two weeks” to slow the spread quickly put 2019, and anything related, out of mind. The subsequent lockdowns on large segments of the world economy, government intervention, and the economic fits-and-starts based on the latest strain of virus drove headlines and market volatility throughout 2020. The election was relatively low on the 2020 list of oddities and macroeconomic factors at play throughout the year, but it did contribute to heightened levels of volatility with VIX® levels climbing in the week leading up to election day.