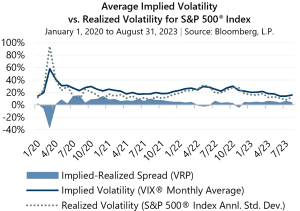
Implied volatility, as measured by the Cboe® Volatility Index (the VIX®), averaged 15.85 in August. Consistent with its typical relationship, average implied volatility exceeded realized volatility, as measured by the standard deviation of daily returns for the S&P 500® Index, which was 12.29% for the month. The VIX® ended July at 13.63, reached an intra-month high of 17.89 on August 17, then drifted to close the month at its August low of 13.57.
The Volatility Risk Premium (VRP) is the difference between the average closing price of the VIX®, or implied volatility, and the realized volatility for the S&P 500® Index. August’s 3.6 percentage-point spread between the two statistics was slightly below the 4.1% historical average.
 2023 has been unexpected in many ways. For one, investors entered the year with gloomy expectations of growth and recession. As August closes, the S&P 500® Index has climbed 18.73% and monthly implied volatility has averaged 17.64% – the lowest level since before the pandemic. Monthly realized volatility averaged 13.24% through August, one of its lowest readings since the pandemic as well.
While volatility has relatively settled so far in 2023, the VRP remains robust with a year-to-date monthly average of 4.40% through August, which is above its historical average. This reflects a persistent shift higher since the U.S. Federal Reserve has begun tightening monetary policy.
VRP is frequently positive and often above its long-term average. Since the inception of the VIX® in January 1990, the VRP has been positive in more than 89% of months. Strategies that sell (write) index options, such as those managed by Gateway, can provide a potential source of improved risk-adjusted return by monetizing this consistent overpricing implied volatility.