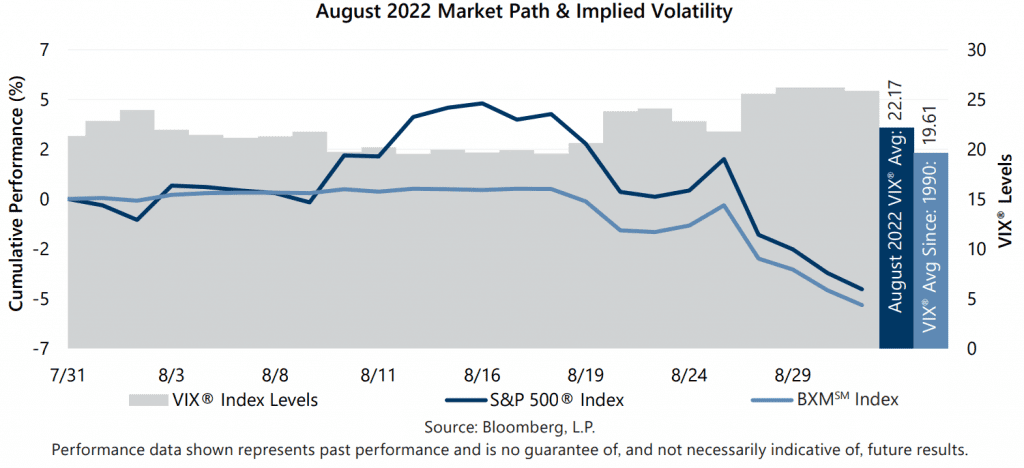
The S&P 500® Index returned -4.08% in August, bringing its year-to-date return to -16.14%. After a 22.99% drawdown from January 4 through June 16, the S&P 500® Index climbed 17.68% from June 16 through August 16. The continuation of the rally in August was driven by a resilient labor market and corporate earnings reports. From July 31 to August 16, the S&P 500® Index climbed 4.32% before declining 8.05% from August 16 through month-end. A recommitment by the Federal Reserve to do whatever it takes to conquer record inflation – for as long as it takes – soured investor optimism and accelerated the market pullback that began mid-month.
The U.S. labor market remained tight and macroeconomic data released in August reflected a resilient economic backdrop despite record inflation, tightening monetary policy and a broad economic contraction. The second estimate of Gross Domestic Product for the second quarter of 2022 showed that the U.S. contracted by an annualized rate of 0.6%, slightly better than the consensus expectation of a 0.9% contraction during the quarter. The July unemployment rate of 3.5% improved from the previous month and was slightly better than the consensus estimate, while the participation rate declined to 62.1%. The July Consumer Price Index, released August 10, remained near record highs with a year-over-year increase of 8.5%, which was slightly below the consensus expectation. Second quarter aggregate operating earnings were on track to decline 2.4% quarter-over-quarter while increasing nearly 17% year-over-year. With over 97% of companies reporting, nearly 80% met or exceeded analyst estimates.
Implied volatility, as measured by the Cboe® Volatility Index (the VIX®), averaged 22.17 in August. Consistent with its typical relationship, average implied volatility exceeded realized volatility, as measured by the standard deviation of daily returns for the S&P 500® Index, which was 19.36% for the month. The VIX® closed July at 21.33 and drifted to an intra-month low of 19.53 on August 12 before climbing to its intra-month high of 26.21 on August 29. The VIX® closed the month at 25.87.
The Bloomberg U.S. Aggregate Bond Index returned -2.83% in August, bringing its year-to-date return to -10.75%. The yield on the 10-year U.S. Treasury Note (the 10-year) ended July at 2.65%, touched its intra-month low of 2.57% on August 1, then climbed to close the month at its intra-month high of 3.19%. Throughout the entire month of August, the yield curve was inverted with the yield on the 2-year U.S. Treasury Note exceeding the yield on the 10-year.
1The BXMSM is a passive total return index designed to track the performance of a hypothetical buy-write strategy on the S&P 500® Index. The construction methodology of the index includes buying an equity portfolio replicating the holdings of the S&P 500® Index and selling a single one-month S&P 500® Index call option with a strike price approximately at-the-money each month on the Friday of the standard index-option expiration cycle and holding that position until the next expiration.
Sources: Morningstar DirectSM, Bloomberg, L.P. Performance data shown represents past performance and is no guarantee of, and not necessarily indicative of, future results.
For more information and access to additional insights from Gateway Investment Advisers, LLC, please visit www.gia.com.