After a partial recovery in March, the S&P 500® Index returned -8.72% for the month of April bringing its year-to-date return to -12.92%. Driving the decline were renewed concerns around COVID and related supply chain disruptions in China adding to a list of investor worries that already included war and uncertainty over whether the Federal Reserve can tame inflation without tipping the economy into recession. The equity market illustrated investor uncertainty with intense volatility over the final two days of the month as the S&P 500® Index lurched forward nearly 2.5% on April 28 before plummeting more than 3.6% on April 29. The market re-entered correction territory with April’s losses and established a new year-to-date low. From its 2022 peak on January 3 through month-end, the S&P 500® Index declined 13.47%.
U.S. macroeconomic data released in April began to reflect the impact of persistent record-high inflation and the growing headwinds facing the economy. The first estimate of Gross Domestic Product for the first quarter of 2022 showed that the U.S. contracted by an annualized rate of 1.4%, much worse than the consensus expectation of slight growth for the quarter. The unemployment rate was better than the consensus estimate, declining from 3.8% in February to 3.6% in March while the participation rate climbed to 62.4%. The March Consumer Price Index, released April 12, continued its record-breaking streak with a year-over-year increase of 8.5% which was above the consensus expectation. First quarter aggregate operating earnings were on track to climb less than 2% quarter-over-quarter while increasing over 41% year-over-year. With slightly more than 52% of companies reporting, nearly 83% met or exceeded analyst estimates.
Implied volatility, as measured by the Cboe® Volatility Index (the VIX®), averaged 24.37 in April. In a reversal of its typical relationship, realized volatility reached 24.51% for the month – as measured by the standard deviation of daily returns for the S&P 500® Index – and exceeded average implied volatility for the period. The breakdown of the typical relationship between implied versus realized volatility occurred as the S&P 500® Index selloff intensified late in the month. April was the first month since March 2020 that realized volatility exceeded implied volatility. The VIX® opened April at 19.63, near its April 4 intra-month low of 18.57, before climbing to an intra-month high of 33.52 on April 26. The VIX® ended the month at 33.40.
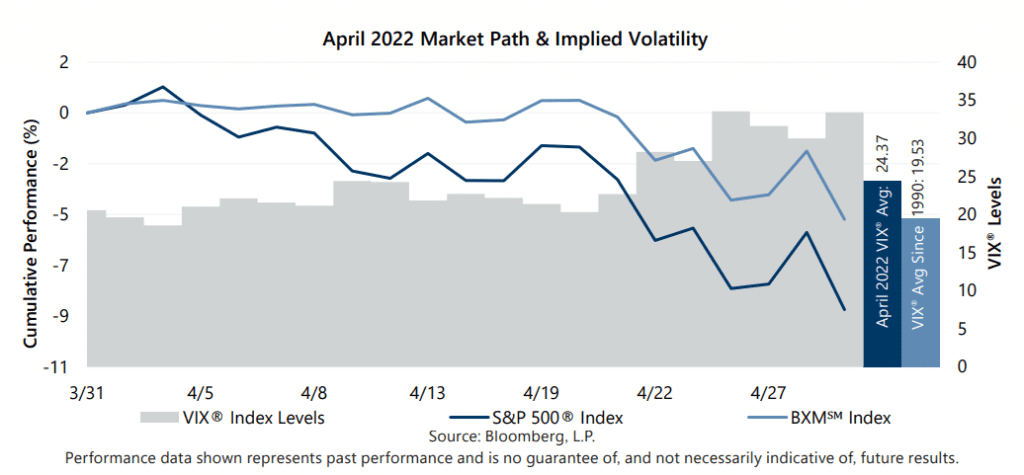
The Cboe® S&P 500 BuyWriteSM Index1 (the BXMSM) returned -4.72% in April, outperforming the S&P 500® Index by 400 basis points (bps) and bringing its year-to-date return to -3.94%. On the third Friday of each month, the BXMSM writes a new index call option as the option it wrote the previous month expires. The premiums the BXMSM collects on its written index call options have significant influence on its return potential during market advances and help to mitigate market declines. Because of the strong market advance over the last half of March, the BXMSM began April with an in-the-money (ITM) written call option. Reduced market exposure from its ITM option plus remaining time premium allowed the BXMSM to produce a return of 0.65% from the beginning of the month through April 13, the day prior to the expiration of its written call option, while the S&P 500® Index returned -1.80%. On April 14, the BXMSM wrote a new index call option with a May expiration and collected a premium of 2.09%. Earning a portion of the premium it received helped the BXMSM provide downside risk mitigation relative to the S&P 500® Index over the remainder of the month. The BXMSM returned -5.33% from its closing value on April 13 through month-end, while the S&P 500® Index returned -7.05% over the same period.
The Bloomberg U.S. Aggregate Bond Index (the Agg) returned -3.79% in April, bringing its year-to-date return to -9.50%. The Agg has posted negative returns in 14 of the last 24 months including seven of eight months in which the S&P 500® Index return was negative. The yield on the 10-year U.S. Treasury Note started April at its intra-month low of 2.38% before climbing to an intra-month high of 2.94% on April 19. The yield on the 10-year closed the month at 2.93%.
1The BXMSM is a passive total return index designed to track the performance of a hypothetical buy-write strategy on the S&P 500® Index. The construction methodology of the index includes buying an equity portfolio replicating the holdings of the S&P 500® Index and selling a single one-month S&P 500® Index call option with a strike price approximately at-the-money each month on the Friday of the standard index-option expiration cycle and holding that position until the next expiration.
Sources: Morningstar DirectSM, Bloomberg, L.P. Performance data shown represents past performance and is no guarantee of, and not necessarily indicative of, future results.
For more information and access to additional insights from Gateway Investment Advisers, LLC, please visit www.gia.com.