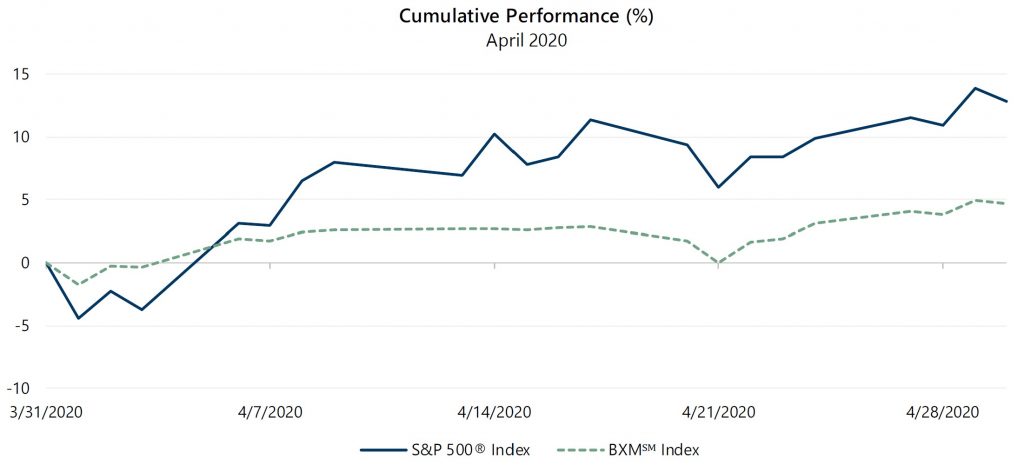
The S&P 500® Index climbed 12.82% in April as a partial market rebound was driven by hope that the severe economic retrenchment caused by efforts to slow the spread of the COVID-19 pandemic may be short-lived. April’s equity market advance was the highest monthly return for the S&P 500® Index since January 1987 and was relatively steady, with returns for the S&P 500® Index positive in 11 out of 21 days. Of the 10 negative days, the largest drop was a 4.41% decline on April 1 and the only days of consecutive decline were April 20 and 21 in which the S&P 500® Index lost 4.80%. The two-day decline resulted in the market’s only losing week for the month, as the S&P 500® Index returned -1.30% for the week ended April 24. After a strong month, the S&P 500® Index posted a year-to-date return of -9.29%. The S&P 500® Index has climbed 30.38% since its March 23, 2020 low. From its all-time high on February 19, 2020, the S&P 500® Index remains down 13.68%.
The economic impact of the pandemic began to show in macroeconomic data released in April. The first estimate of Gross Domestic Product growth for the first quarter of 2020 was -4.8%, worse than the consensus estimate of -3.7% and contrasted with the 2.1% growth booked in the final quarter of 2019. Ongoing virus mitigation efforts caused a stark deterioration in the employment picture – more than 25 million people filed jobless claims over the last week of March and month of April. The March labor participation rate ticked down from 63.4% to 62.7% and the unemployment rate climbed from 3.5% to 4.4%. The March Consumer Price Index, released on April 10, showed a 1.5% year-over-year increase, at the bottom of consensus expectations. With nearly 52% of companies reporting, first quarter aggregate operating earnings were on track to decline 5.55% quarter-over-quarter and 3.04% year-over-year. However, more than 72% of companies that have reported earnings met or exceeded analyst estimates.
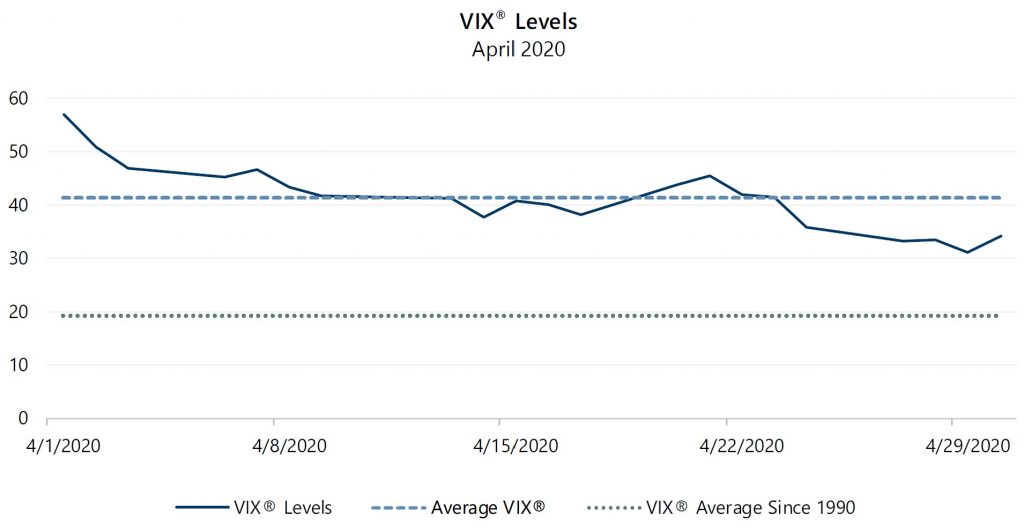
Implied volatility, as measured by the Cboe® Volatility Index (the VIX®), averaged 41.45 in April, moderating from extreme levels witnessed in March, but still well above its historical average of 19.30. The VIX® opened at its April high of 57.06 then generally declined throughout the month, reaching an intra-month low of 31.23 on April 29. The VIX® closed the month at 34.15. Resuming its typical relationship, implied volatility exceeded realized volatility, as measured by the standard deviation of daily returns. The standard deviation of daily returns of the S&P 500® Index was 41.34% for the month.
Source: Bloomberg, L.P.
The Cboe® S&P 500 BuyWriteSM Index1 (the BXMSM) returned 4.64% in April, underperforming the S&P 500® Index by 818 basis points (bps). On the third Friday of each month, the BXMSM writes a new index call option as the option it wrote the previous month expires. The premiums the BXMSM collects on its written index call options have significant influence on its return potential over a period when the market advances and help to mitigate market declines. The premiums collected by the BXMSM in March and April were not enough to keep pace with April’s rapid equity market advance. Most of the BXM’sSM April return was generated early in the month as it earned the remainder of the premium collected from the index call option written in March. From the beginning of the month through April 8, the BXMSM returned 2.42% while the S&P 500® Index advanced 6.46%. The equity market’s rapid advance put the BXM’sSM April index call option deep in-the-money, resulting in very low market exposure and little return potential as the market continued its advance. From its closing value on April 8 through April 17, the expiration date of its option, the BXMSM returned 0.41% while the S&P 500® Index returned 4.57%. On April 17, the BXMSM wrote a new index call option with a May expiration as its April option expired. The premium collected on the new index call option as a percentage of the BXM’sSM underlying value was 3.61%. Despite a sharp decline on April 20 and 21, the S&P 500® Index posted a return of 1.34% from its closing value on the April 17 through month-end. The BXM’sSM option premium provided downside protection and helped the BXMSM generate a higher return than the S&P 500® Index over that period. The BXMSM returned 1.75% from April 17 through month-end and delivered 202 bps of downside protection when the S&P 500® Index declined 4.80% on April 20 and 21.
Source: Bloomberg, L.P. Performance data shown represents past performance and is no guarantee of, and not necessarily indicative of, future results.
The Bloomberg Barclays U.S. Aggregate Bond Index returned 1.78% in April. The yield on the 10-year U.S. Treasury Note (the 10-year) was relatively rangebound in April, starting the month at 0.58% before reaching an intra-month high of 0.77% on April 8. The 10-year then drifted to an April 21 intra-month low of 0.57% before closing the month at 0.64%.
1The BXMSM is a passive total return index designed to track the performance of a hypothetical buy-write strategy on the S&P 500® Index. The construction methodology of the index includes buying an equity portfolio replicating the holdings of the S&P 500® Index and selling a single one-month S&P 500® Index call option with a strike price approximately at-the-money each month on the Friday of the standard index-option expiration cycle and holding that position until the next expiration.