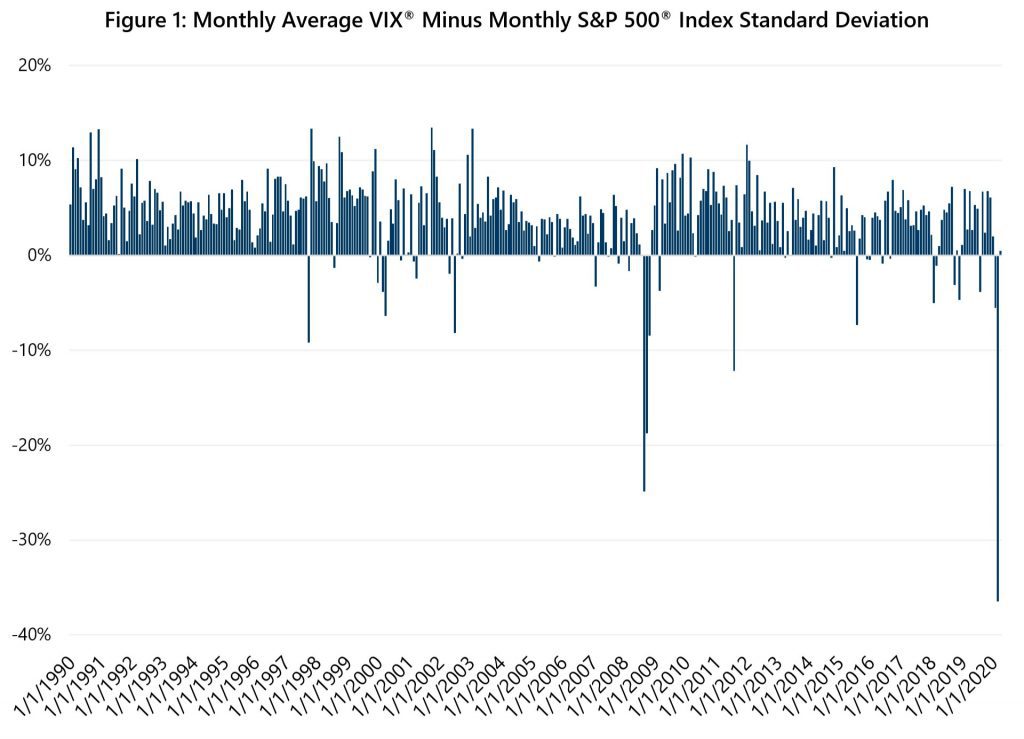
Investment strategies that combine broad-based equity market exposure with index option writing offer the potential for a consistently lower risk profile and enhanced risk-adjusted return. In this type of strategy, the primary source of enhanced risk-adjusted return is the volatility risk premium (VRP). VRP derives from the phenomenon of the implied volatility component of index option prices frequently exceeding the realized volatility experienced by the underlying index. Index option-writing strategies can benefit from this phenomenon as writing (selling) options frequently allow for the selling of overpriced volatility. Figure 1 shows the consistency with which the monthly average Cboe® Volatility Index (the VIX®) levels have exceeded the S&P 500® Index’s annualized standard deviation of daily returns on a monthly basis. VIX® levels have exceeded realized volatility in nearly 90% of months since its inception in 1990. The typical relationship between the two statistics tends to invert during times of market stress or crisis. As the data points for the fourth quarter of 2008 and the first quarter of 2020 show, the largest inversions tend to occur during the most negative market environments.
The following discusses the implications of volatility inversions, or negative VRP, for investment strategies that sell implied volatility indirectly through index options or directly through over-the-counter derivative contracts that isolate the implied-vs-realized relationship, known as variance swaps. First, however, we review how VRP has changed over time.
A higher-frequency calculation of VRP that acknowledges the forward-looking nature of implied volatility further clarifies what has been available to participants in options and volatility markets over time. Figure 2 shows the spread between 21-day standard deviations1 for the S&P 500® Index and the closing value of the VIX® at the beginning of each 21-day period. The graph of this daily calculation since January 1990, in Figure 2, shows that VRP is more dynamic than what is revealed by the monthly calculation in Figure 1.
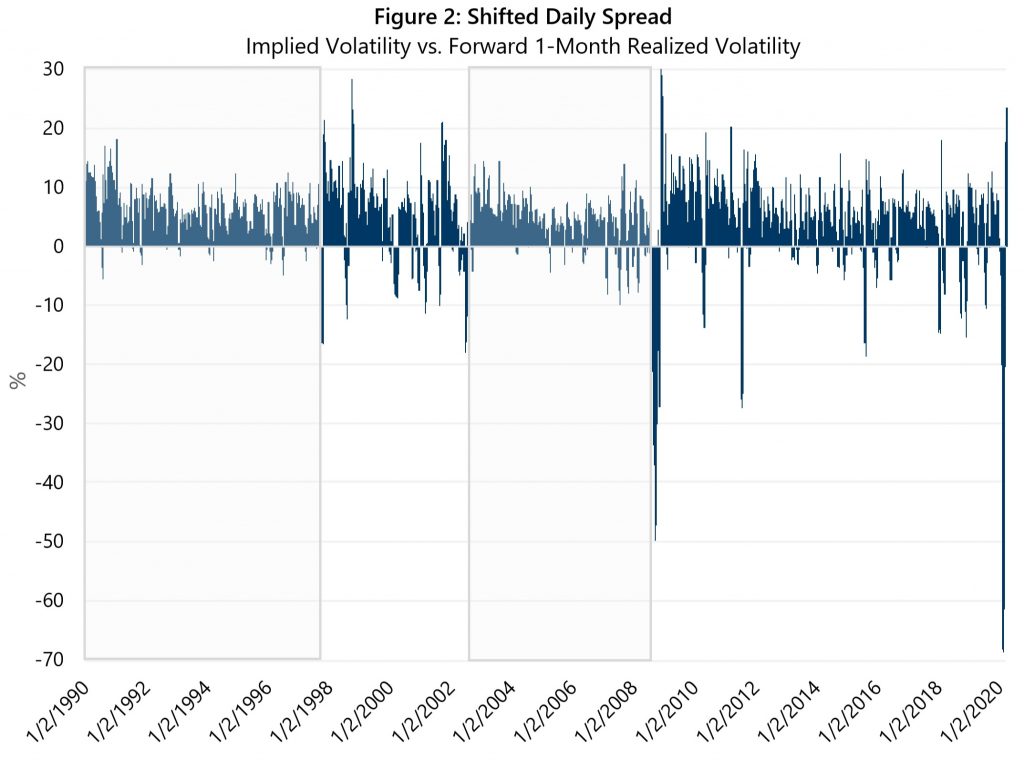
Figure 2 shows that VRP has changed over time. Its most stable period was from January 1990 through September 1997. Over that stretch it was positive 94% of the time while averaging 5.2 points. In addition to being rare, inversions were shallow over this period, with negative observations averaging just -1.3 points. From October 1997 through September 2002, inversions became larger and occurred in 22% of observations. VRP was relatively stable from October 2002 through August 2008 with inversions in 17% of observations. Since the Great Financial Crisis, VRP has been volatile but remained consistently positive. From September 2008 through April 2020, VRP was positive in 82% of observations, and the higher volatility of VRP has been expressed through a wider range. The post-crisis era has featured new highs for positive VRP and new lows for negative VRP with positive observations averaging 5.8 points and negative observations averaging -9.9 points.
The relationship between implied and realized volatility is more dynamic than it used to be, and the magnitude of inversions has gotten larger. As long as VRP exhibits these characteristics, purely systematic investment strategies that are based on past behavior of VRP may post unexpected outcomes. Similarly, strategies that attempt to isolate VRP, like those utilizing variance swaps, may show strong gains when VRP is positive but may be prone to surprisingly large losses when VRP inverts.
Rather than betting on the direction of volatility or attempting to anticipate whether VRP will be positive or negative, Gateway’s approach has consistently focused on positioning its strategies to benefit from VRP when it is positive while taking measures to maintain consistent risk profiles in the event of steep equity market declines or VRP inversions. This approach requires actively managing index option positions in a ‘risk first’ manner, rather than holding positions to expiration. It is an approach that has served Gateway investors well for over 40 years.
1 Equity and index option markets are open approximately 21 days per month, on average.