Does the equity market’s strong rally from its low point in March 2020 signal that the worst of the economic damage and equity market carnage wrought by COVID-19 pandemic are over? Not necessarily.
Recent economic data and pandemic statistics have been encouraging. There has been a stronger-than-expected snapback in key economic stats, such as employment and retail sales. Furthermore, as of mid-June, national trends in positive COVID-19 test rates, hospitalizations and COVID-19 deaths are well below the peak numbers of April.
The market has had a strong advance from the lows of March that reflects the trends in some economic and pandemic statistics through mid-June. The S&P 500® Index rallied over 45% from its year-to-date low on March 23 through June 8, bringing it to less than 4% below its all-time high set on February 19. However, the decline and recovery phases of recent bear markets show that strong advances alone do not signal that the market bottom has been reached or that a partial recovery will soon reach fruition.
As illustrated in Charts 1 and 2, the bear markets of 2000 – 2002 and 2007 – 2009 did not unfold in straight-line declines and recoveries. The initial declines of both periods were followed by additional steep selloffs to new lows after double-digit advances that were sharp, but ultimately partial and temporary. The final decline in 2002 was a drop of over 19% and it started from a price level that was more than 30% below the year-2000 high. Similarly, the final decline of 2009 was over 27% and it started from a point that was nearly 40% below the market’s 2007 high.
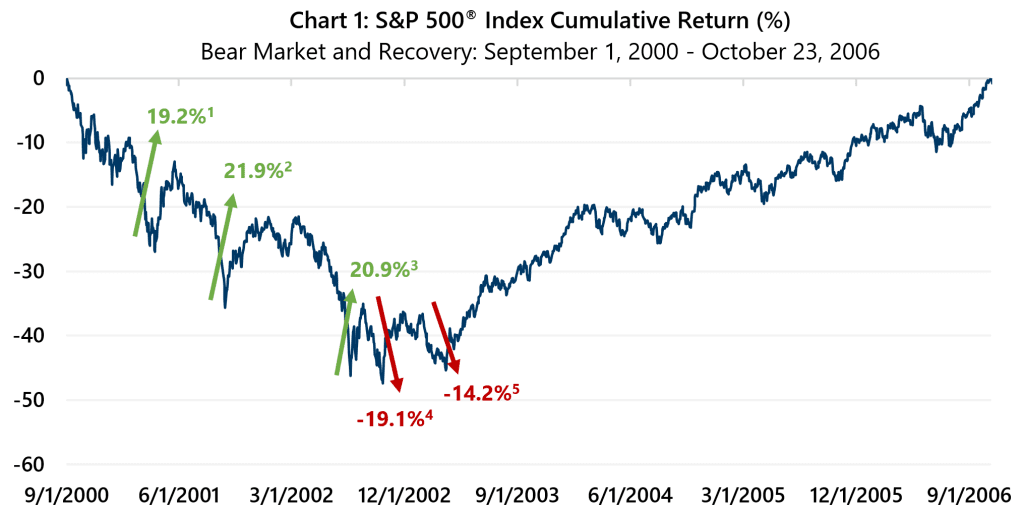
Highlighted performance periods include 1: 4/4/2001 – 5/21/2001, 2: 9/22/2001 – 1/4/2002, 3: 7/23/2002 – 8/22/2002, 4: 8/22/2002 – 10/9/2002, 5: 11/27/2002 – 3/11/2003 Source: Bloomberg, L.P. and Morningstar DirectSM
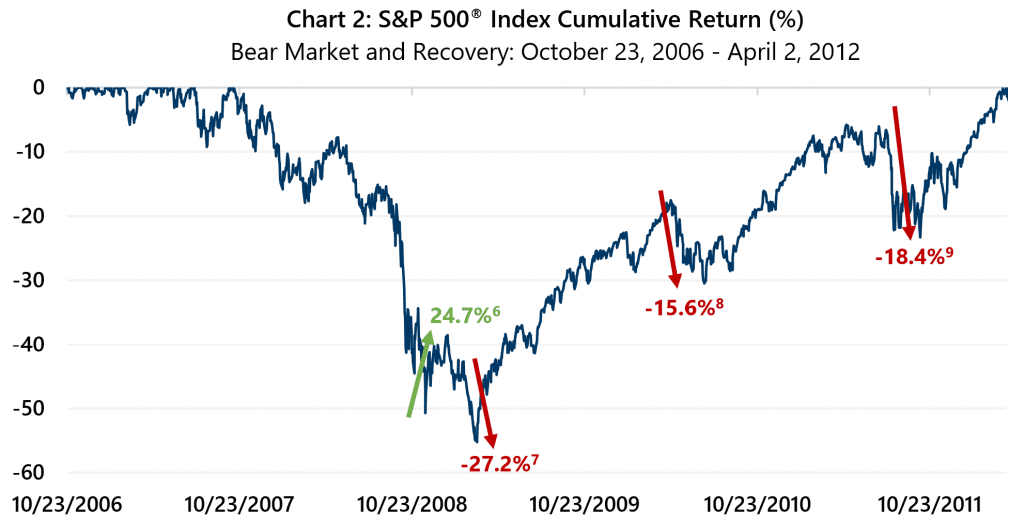
The recovery phases from the bear markets of 2000 – 2002 and 2007 – 2009 experienced fits and starts. As shown in Chart 1, the recover from the 2000 – 2002 bear market had a double-digit pullback after the market had advanced more than 20% from its October 2002 low. Chart 2 shows that the recovery from the 2007 – 2009 bear market had two pullbacks of more than 15%.
While the circumstances of the current market environment are unlike any of the past, what today’s market has in common with bear market recoveries of the past is an uncertain outlook. Investors who expect this recovery to be smoother than recoveries of the past may be in for disappointment.