 The S&P 500® Index returned -0.68% in April, bringing its year-to-date return to -4.92%. April’s return seems like a reprieve compared to March’s decline of 5.63%, but masks what became the 11th largest drawdown since 1987. From its February 19 all-time high, the S&P 500® Index declined 18.75% through April 8. In April, the announcement of the new U.S. tariff policy and its fogging of growth expectations triggered massive equity market decline and crisis-level volatility. As the news was processed and policy progressed, the market staged an equally impressive recovery. From the start of April through April 8, the S&P 500® Index declined 11.19% before climbing 11.83% from April 8 through month-end.
Data released in April reflected weakened growth expectations with steady inflation and an uncertain outlook for the labor market. The first estimate of Gross Domestic Product for the first quarter of 2025 was negative for the first time since 2022 and lower than the consensus estimates. The year-over-year March Consumer Price Index released April 10 was less than consensus estimates and the prior period, while the quarter-over-quarter Personal Consumption Expenditures (PCE) Price Index climbed higher than the consensus estimates and prior reading. With just over 56% of S&P 500® Index companies reporting, corporate earnings are on track to be positive for the first quarter of 2025. Aggregate operating earnings increased 2.1% quarter-over-quarter and 10.5% year-over-year. More than 79% of reporting companies either met or exceeded analyst estimates.

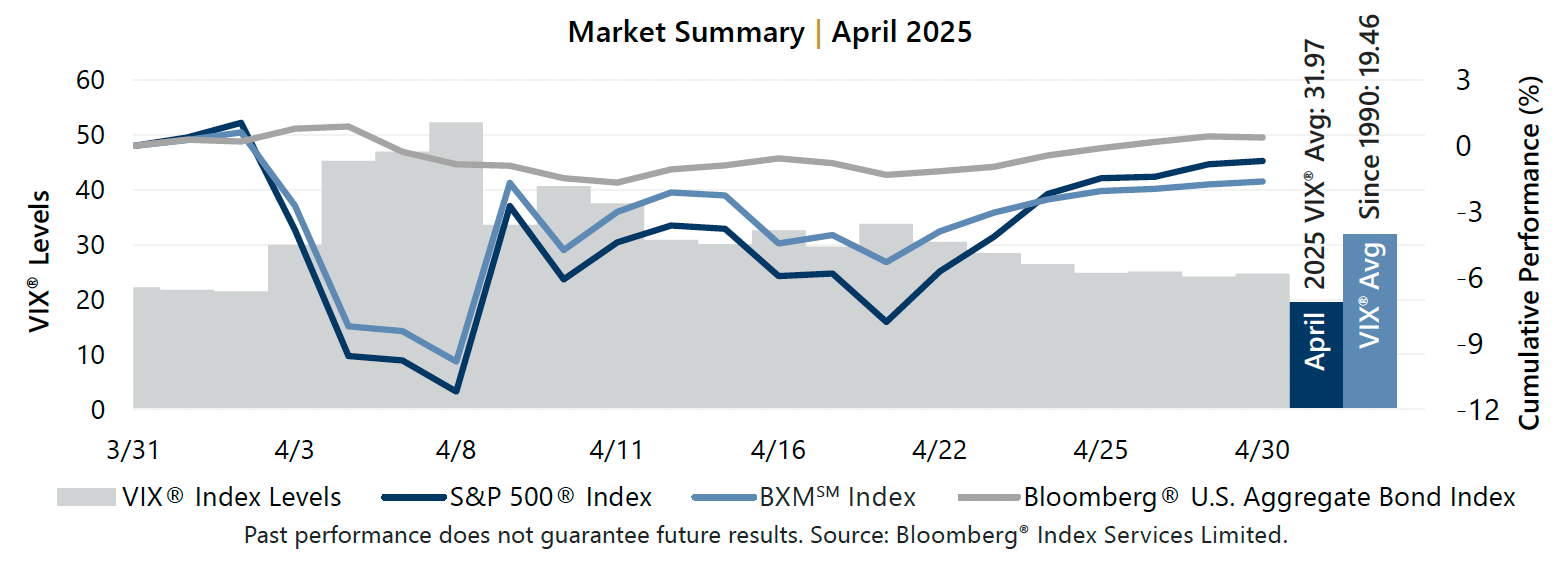
 The Cboe® S&P 500 BuyWriteSM Index[i] (the BXMSM) returned -1.63% in April, bringing its year-to-date return to -4.67%. The premiums the BXMSM collected as a percentage of its underlying value provided loss mitigation and are an important component of performance. The premium the BXMSM collected as a percentage of the BXM’sSM underlying value was 3.45% in April – more than 68% higher than the premium collected in March and a reminder of how option writing benefits from heightened levels of volatility. The rules-based timing of the BXMSM’s option writing and the level of premiums collected as a percentage of its underlying value provided significant loss mitigation during periods of market decline and contributed to the BXMSM’s participation in periods of advance. From the start of April through April 8, the BXMSM offset 136 basis points of loss mitigation relative to the S&P 500® Index with a return of -9.83%. As the equity market advanced from April 8 through month-end, the BXMSM climbed 9.09% – capturing nearly 77% of the market’s advance.
The Bloomberg® U.S. Aggregate Bond Index returned 0.39% in April, bringing its year-to-date return to 3.18%. The yield on the 10-year U.S. Treasury Note (the 10-year) ended March at 4.21% and reached an April low of 3.99% on April 4 before touching an intra-month high of 4.49% on April 11. The 10-year ended the month at 4.16%.