Implied volatility, as measured by the Cboe® Volatility Index (the VIX®), averaged 20.17 in January. Consistent with its typical relationship, average implied volatility exceeded realized volatility, as measured by the standard deviation of daily returns for the S&P 500® Index, which was 16.66% for the month. The VIX® ended December at 21.67, reached an intra-month high of 22.90 on January 3, then drifted to an intra-month low of 18.35 on January 13. The VIX® ended the month at 19.40.
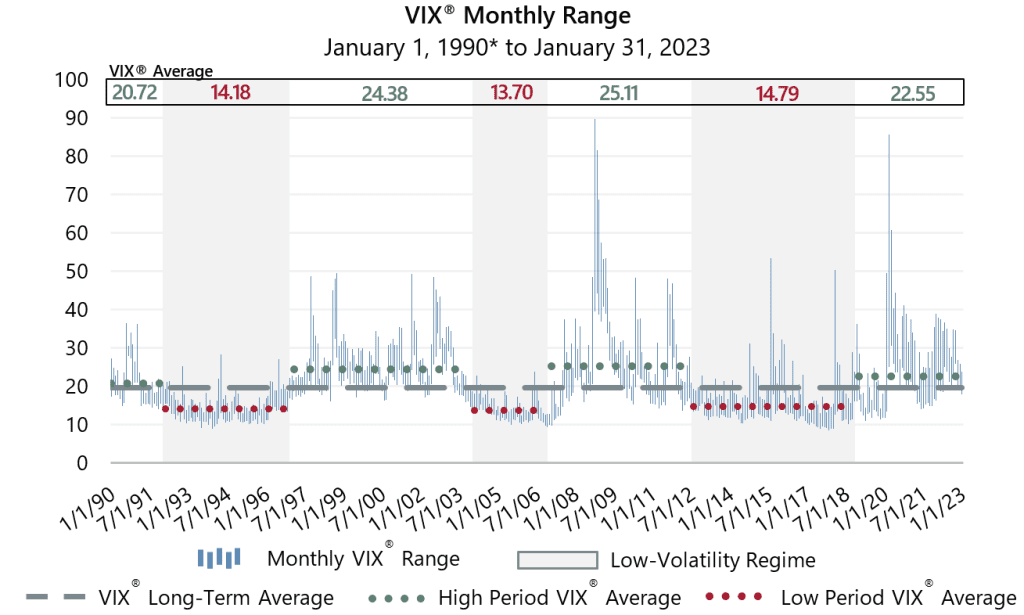
The January low was the lowest VIX® reading since early January 2022 but still higher than the pandemic-era low of 15.01 set on October 21, 2021. While the January low and the pandemic-era low are both below 19.67, the average VIX® level since its inception in 1990, both readings are above the 14.72 average from July 2012 through October 2018. Federal Reserve policies of quantitative easing and zero interest rates contributed to the persistently low volatility of the mid-twenty-teens.
Past performance is not indicative of future results. Data source: Bloomberg, L.P. *VIX® chart is based on published VIX® data which began on January 1, 1990. High and low measures are based on intra-day values; averages are based on daily closing values.