Market conditions reflected an unusual mix of resilience and anxiety as 2020 came to a close. The equity market advanced in November and December despite worsening pandemic statistics, political tension over election results and partisan bickering over over the economic relief bill. Meanwhile, the Cboe® Volatility Index® (the VIX®) remained solidly above its long-term average even as the market ascended to new highs. At year-end, the VIX® futures curve reflected expectations of the VIX® remaining in the mid-20’s well into 2021.
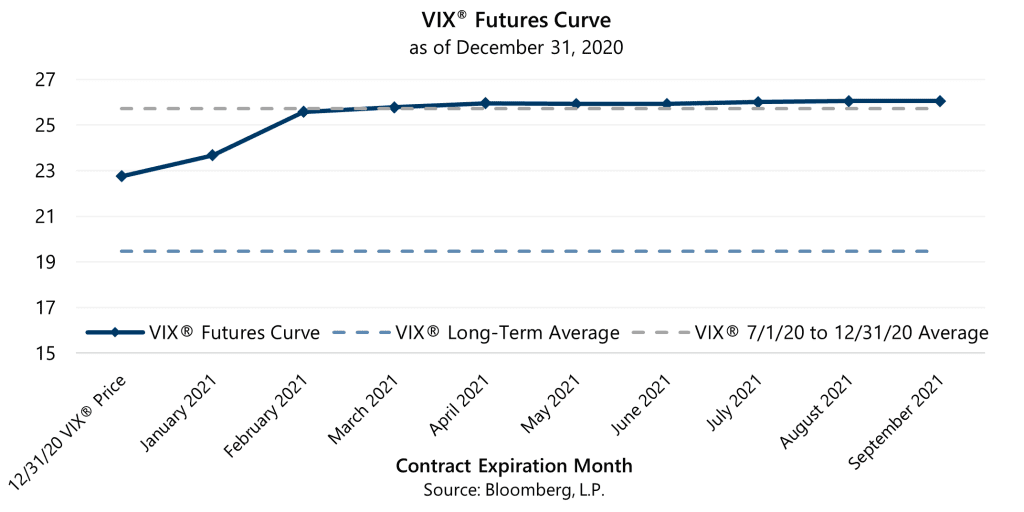
As illustrated in the chart above, there is potential for certain aspects of the 2021 volatility environment to be consistent with 2020. Specifically, as the VIX® futures curve suggests, above-average implied volatility may continue and, if it does, attractive Volatility Risk Premium (VRP), the spread between implied volatility and realized volatility, may continue also.
Investors faced new risk factors early in 2020 and their novelty helped explain the extreme volatility of the first quarter. Realized and implied volatility levels both retreated from first quarter extremes as investors gained a better understanding of the risk factors, though implied volatility remained above-average in the second half of 2020. Since many of the risk factors present in 2020 may continue to exist in 2021, it is not surprising that the VIX® futures curve reflects expectations of levels similar to the VIX® average over the last half of 2020. We acknowledge that the VIX® futures pricing is an indicator of current sentiment rather than a reliable forecast of future volatility and, as a result, current expectations of future volatility could be either too high or too low.
Above-average implied volatility led to very attractive VRP levels in the second half of 2020—August and December were, respectively, the highest and second-highest monthly spreads between implied and realized volatility over the history of the VIX®. Somewhat surprisingly, though, low realized volatility contributed as well. A factor driving relatively low realized volatility has been low correlation across individual stocks. Prospects for businesses related to home-based work, entertainment and shopping have waxed and waned opposite to the prospects for more economically sensitive businesses as the prospects for changes to COVID-19 mitigation and economic stimulus policies have changed. The low correlation of price movements across business sectors has had a volatility-reducing diversification effect on the broader market. The disparate impact of pandemic-related policy changes on businesses that have benefitted versus businesses that have been hurt by the pandemic is a trend that may persist into 2021, regardless of how long the pandemic persists.
A subtle but important factor that may contribute to 2020 volatility conditions continuing into 2021 is how the mix of buyers and sellers in the options market shifted in 2020. Analysis of option contract volume suggests that new buyers, primarily focused on options on individual stocks, have entered the space while several sizable sellers of volatility-linked options on indexes have exited.
Contract volume for options on individual stocks exploded in 2020, coming in 68% higher than 2019 according to Options Clearing Corporation (OCC) data. Most of the increase in volume occurred after the first quarter and this increase in volume is consistent with the behavior of investors seeking upside leverage to the equity market recovery through call option purchases.
This individual stock option buying activity impacts the overall market for index options, potentially inducing market making firms to buy volatility-linked index option contracts on broad based indexes like the S&P 500® Index or the VIX® itself, thus adding upward pressure to implied volatility levels. Specifically, market makers who sell options on individual stocks to meet the demand of buyers often hedge the risk exposures that result from their market-making. For example, market makers who write (sell) options of high volatility stocks like Apple, Microsoft or Netflix to meet the demand of buyers may end up with sizeable short positions in implied volatility, due to the high implied volatility priced into the options of such stocks. These market makers are potentially exposed to significant losses if volatility spikes. To hedge this risk, market makers may seek long exposure to implied volatility through purchases of volatility-linked index option contracts. Market maker volume in these contracts is consistent with this activity as it increased 13% for S&P 500® Index contracts and 18% for VIX® contracts from 2019 to 2020.
Interestingly, the increase in market maker volume for these index option contracts occurred as the total volume for the contracts decreased. Customers (including hedge funds, mutual funds, pension funds and individual investors) of OCC Clearing Member firms traded fewer S&P 500® Index option contracts and VIX® option contracts in 2020 relative to 2019. The decrease in customer activity was large enough to lower overall volume in these contracts despite the increase in market maker volume. This change in customer volume is consistent with reports that several sizable volatility-selling strategies ceased operations after incurring large losses when volatility spiked to record levels in the first quarter. Volatility-selling strategies typically sell volatility-linked derivatives such as options on the S&P 500® Index and the VIX®, potentially adding downward pressure to implied volatility levels when the managers of such strategies are active in the market.
Gateway has helped investors navigate through markets during periods of unexpectedly high volatility, and periods of unexpectedly low volatility. Similarly, though our strategy benefits from periods when implied volatility exceeds realized volatility, Gateway’s active and disciplined approach has successfully maintained the risk profiles of its strategies during reversals of the typical relationship between the two statistics. Whatever 2021 may bring, the firm will remain committed to its consistent approach that has, for over 40 years, assisted clients in their pursuit of long-term returns with lower risk than the equity market.
*For more information and access to additional insights from Gateway Investment Advisers, LLC, please visit www.gia.com/insights.